ROSSA Data Ingestion Guide
Version 1
2/16/2026
Current Experimental Approaches Being Accepted
Genetic Animal Models
Skeletal phenotyping studies using genetically modified animal models are currently being accepted. The submission process seeks to collect data on a wide array of genetic mutants including global knockouts, conditional knockouts, spontaneous, and disease models.
Preclinical Drug Testing
Skeletal phenotyping studies that test and compare individual drug treatments, drug cocktails, or even drug treatments performed in a sequential manner are currently being accepted.
Gonadectomy
Skeletal phenotyping studies where a gonadectomy was performed on wild type animals or in conjunction with a genetic mutant or a drug treatment.
Complex Combined Experimental Studies
We understand how complicated animal studies can get and have designed the ingestion process in a manner that allows investigators to combine genetic, drug, and gonadectomy variables in desired animal groupings.
Future Experimental Approaches in the Pipeline
Our group is working hard to design the data submission process to be as comprehensive as possible. Future plans include the experimental categories detailed below. If you desire an experimental category that currently is not available, please contact us (rossa@uchc.edu). We are here to support the skeletal community.
- Mechanical Loading/Unloading Studies
- Comparing Animal Diets (Testing Nutrients, Phytochemicals, Probiotics)
- Circadian Rhythm Studies (Comparing different light/dark cycles)
Currently Accepted Skeletal Phenotyping Analyses Approaches
We have focused on collecting phenotyping analysis approaches that are widely and routinely used by members of the scientific community (detailed below). To view specific measurement parameters for each type of analysis please visit the Measurement Parameters page. Please contact us (rossa@uchc.edu), if you believe we should include other analysis types.
- Dual X-Ray Absorptiometry
- Microcomputed Tomography
- Bone Histomorphometry
- Mechanical Strength Testing
- Clinical Chemistry Analytes
Preparing Your Data for Upload
Data File Types
Currently ROSSA only accepts spreadsheet data in CSV file format (further described below). Future plans will include the ability to upload image files from microcomputed tomography and bone histomorphometry studies.
Preparing Your Personal Spreadsheet Files
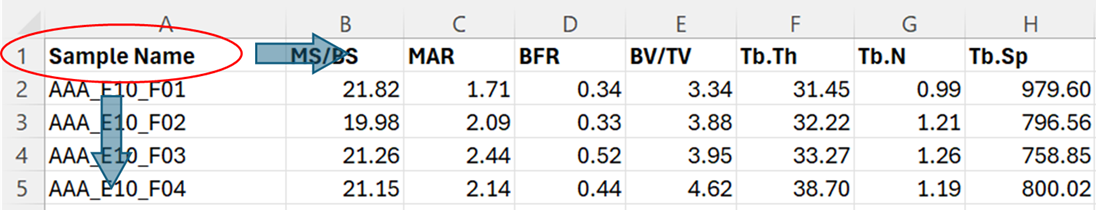
ROSSA currently accepts CSV formatted spreadsheet files of individual rodent datasets. For database security purposes, we cannot accept spreadsheet data saved in Excel file formats, so please save each sheet of data in your Excel file to separate CSV files before submission. The data ingestion process has been designed to directly accept your spreadsheet data files, however, to accurately read your spreadsheet it is important to specifically write "Sample Name" in the column header where your sample id's exist and in the same row as your measurement parameters as demonstrated in Figure 1.
ROSSA Accepts Preconfigured and Custom Measurements
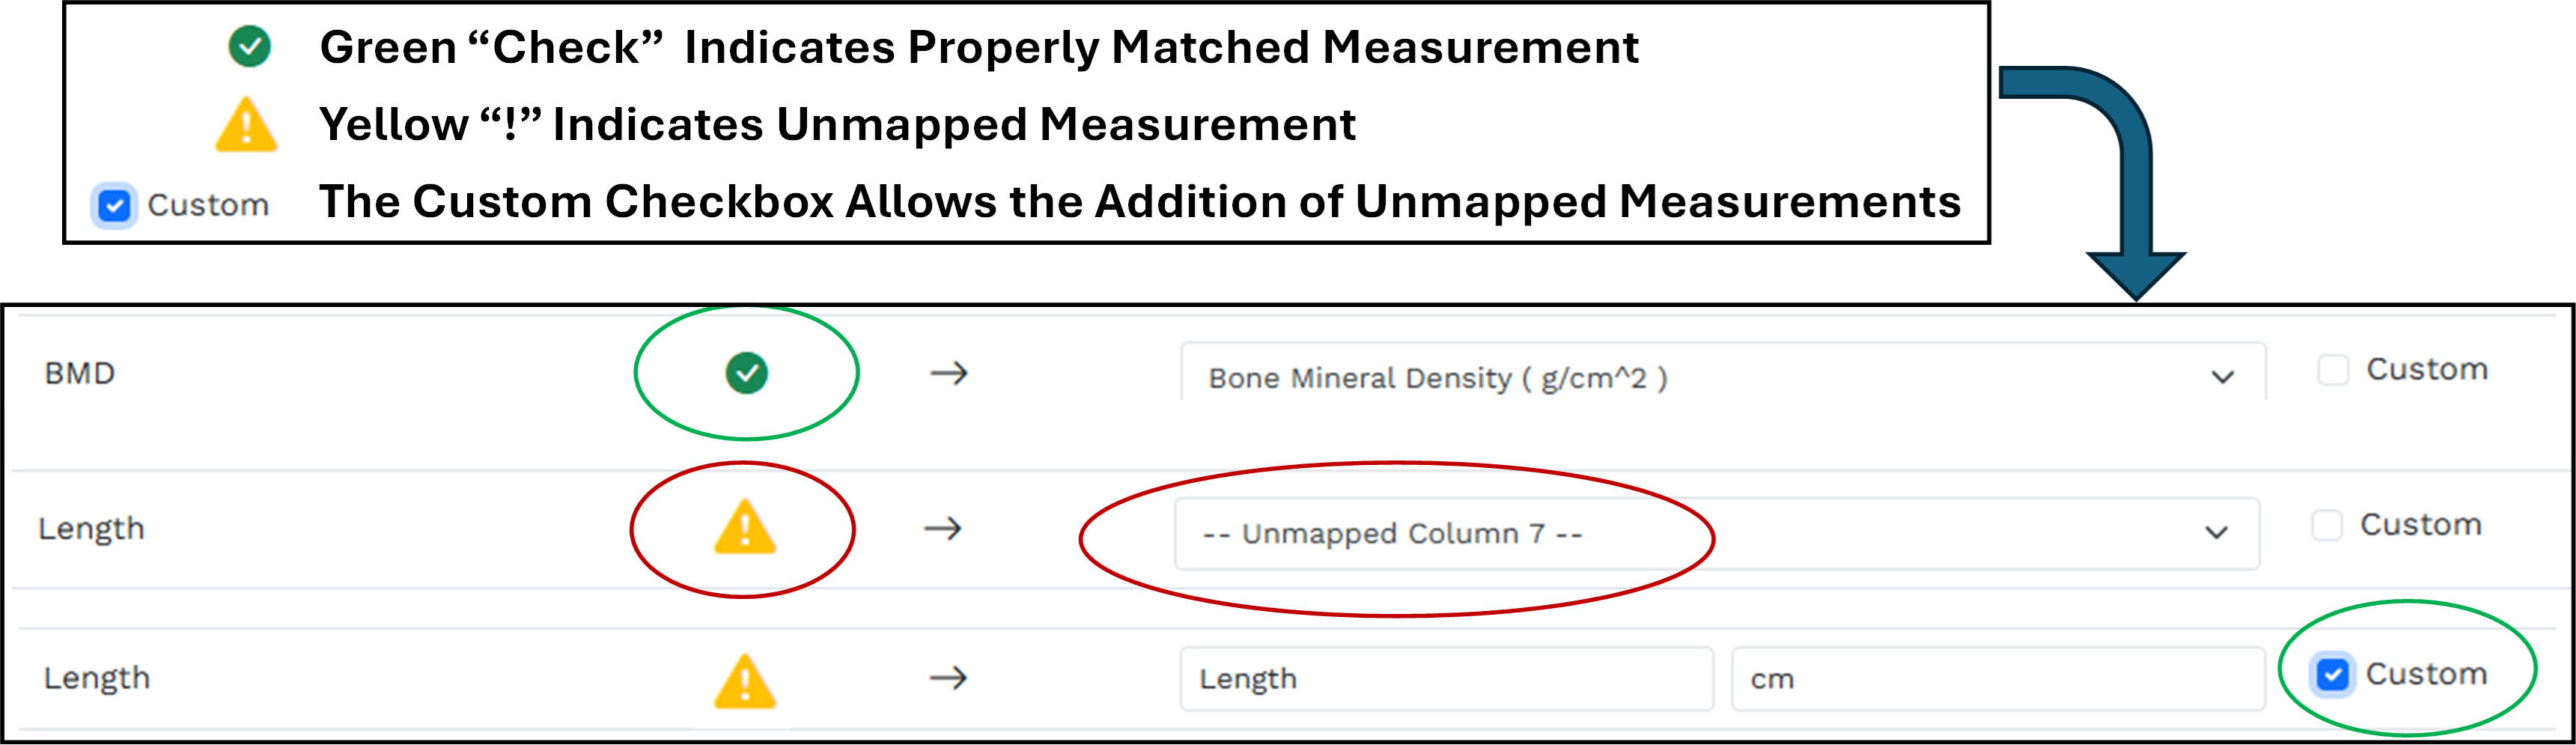
To ensure your data is accurately read and annotated, after uploading the spreadsheet enters a viewer that provides human-in-the-loop validation to confirm or correctly match measurement parameters (Figure 2). Correctly mapped measurement parameters contain a green checkbox next to them. Incorrectly mapped or "unmapped" measurement parameters contain a yellow triangle contain a (!) next to them. Unmapped measurement parameters can occur for two reasons. One, while the measurement parameter is properly configured in ROSSA, our list of synonyms did not match what is being used to represent the measurement parameter in the user's spreadsheet. (To learn what measurement parameters ROSSA has been preconfigured with please visit the Measurement Parameters page.) For this, we ask users to first look for the measurement parameter in the dropdown and select the appropriate measurement. The other reason for an unmapped measurement is that ROSSA is not preconfigured with this measurement parameter. If this is the case and you want this measurement to be part of a viewable dataset, we ask you to use the custom checkbox and input the measurement parameter and its measurement unit. Note that it is not necessary to map all the information in your spreadsheet. We understand that your spreadsheet may contain content that is not of interest to the research community.
Optional Use of Data Template Spreadsheet Files
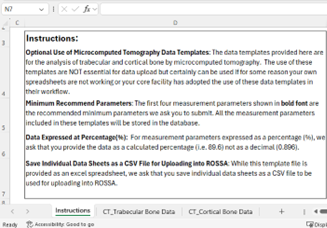
As an alternative to your personal data files, we have also generated spreadsheet template files for different phenotyping analysis including DEXA, Microcomputed Tomography, Bone Histomorphometry, and Mechanical Strength Testing. The use of these template files is NOT essential for data upload but certainly can be used if for some reason your own spreadsheets are not working or your core facility has adopted the use of these data templates in their workflow. All data template files can be downloaded as excel files. The contents of template files vary with the corresponding analysis type. Figure 3 provides an example of the microcomputed tomography data template file, which contains three sheets. Sheet 1 is an instruction sheet, sheet 2 contains a layout with trabecular bone measurement parameters, and sheet 3 contains a layout to input cortical bone data. Note, that while the datasheet can be downloaded as an excel file, for upload into ROSSA individual Excel data sheets should be saved as separate CSV files.
Data Submission into ROSSA
User Account/Login
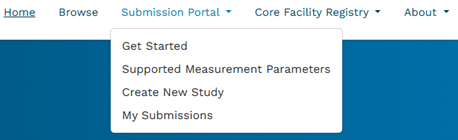
To submit data into ROSSA, we require you to create a user account. For this, go to the top right corner of the webpage and select "Create Account." Provide your name, email address, and password to register. Upon submission, you should receive an email confirming your registration. Clicking the link within this email will take you to the Data Submission Portal quick guide to data submission (described below). While we don't anticipate lengthy submission times, don't be concerned if you cannot complete your submission in one session. The progress of your study is tracked and progressively saved. To complete your submission at another time, simply Login, go to the submission portal dropdown (Figure 4) and select "My Submissions", which will take you to a webpage showing the progress of your study. Here simply select "continue study" to continue filling out the submission form.
Data Submission Portal
If not already here from registering an account, select the "Submission Portal" dropdown in the top navbar (Figure 4). Upon selection, a drop-down menu will show four items related to the data submission process. We recommend starting with the "Submit Your Data" page.
Submit Your Data
The “Submit Your Data” page provides a variety of content related to the submission process including, (1) scope of submission, (2) publication and embargo policy, (3) access to data submission help guides, (4) experimental and (5) phenotyping approaches accepted, and (6) tips for filling out the form. This page also includes a “Quick Guide to Data Submission,” which provides you with a brief set of instructions and an overview of the submission process.
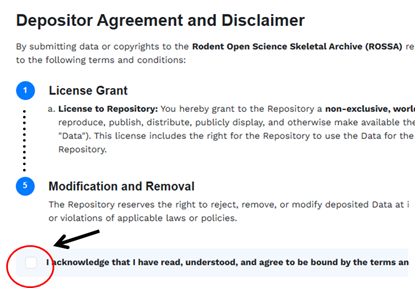
Depositor Agreement
At the bottom of the “Submit Your Data” page is a button that will take you to the Depositor Agreement. Here we ask you in good faith to be as accurate, honest, and complete as possible in your submission. We also provide extreme transparency of our policies and require you to acknowledge reading, understanding, and agreeing to our policies before being able to create a new study. Once the box is checked, an “initiate study submission” button will appear (Figure 5). Clicking on this button will take you to the start of the data ingestion form.
Note: If you have not registered for an account or logged in, clicking this button will take you to a Login page. You are required to have an account to submit data and need to be logged in to fill out the submission form.
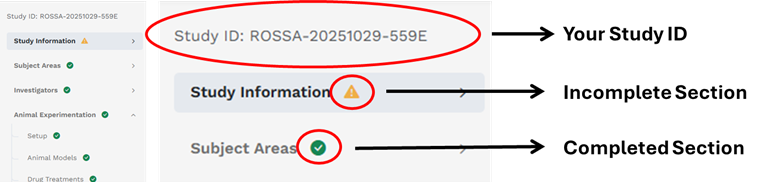
Sidebar Navigation and Tracking
Upon entering the data submission form you will notice a sidebar on the left detailing different sections of the form. The sidebar serves two main functions. First, provide a simple way to navigate from one part of the form to another by simply clicking on a section title. Second, providing feedback to you based on the use of symbols (Figure 6). Yellow triangles with containing an! indicate incomplete sections, while green circles with a check indicate complete sections. The form also contains the typical red asterisk * for required input fields.
Guidance During the Submission Process
To support your data submission efforts, at the top right corner of every page in the submission form is a “Help Guide” button that will take you directly to instructions related to the page you are on.
Sections of the Data Submission Form
For the best user experience, we ask that you fill out the form in the order provided. At the bottom of each section, please remember to click save and continue.
Section 1: Study Information:
Section 1 of the form collects important but basic study information including study title, study summary, funding sources, conflicts of interest, and study completion date.
Submission of Published and Unpublished Studies
ROSSA accepts data submissions from both published and unpublished studies. However, to ensure data quality, only data from peer-reviewed published studies will be publicly shared and searchable within the portal. Unpublished data will be securely stored but remain private until publication information is provided.
For Published Studies
Please provide the Digital Object Identifier (DOI) and PubMed ID (PMID) for your publication. Because ROSSA collects limited metadata, this information is crucial for users who want to learn more about your study and access the full context of your research.
For Unpublished Studies
If you are currently preparing or submitting your work for peer review, you may still submit your data to ROSSA by providing an embargo period start date and estimated embargo length. At the end of your embargo period, we will send you a notification requesting that you either (1) provide your DOI and PMID if successfully published, or (2) extend your embargo period if needed.
Important
When preparing your manuscript, please include the ROSSA ID generated during your data submission. This allows readers of your published work to easily find and view your skeletal phenotyping data within the ROSSA portal, creating a direct link between your publication and the underlying data.
Large-Scale Studies
This form is designed for individual studies. If you are conducting a large-scale screening project involving multiple animal lines or a high-throughput phenotyping effort, please contact us directly to discuss custom approaches for adding your data to the database.
Section 2: Subject Areas
The Subject Areas section helps make your study discoverable by capturing key metadata about your research focus. This section is organized into four tabs: Thematic Areas, Tissue Interactions, Cell Types, and Disease Search. While this section should not take long to complete, the information you provide here is essential for ensuring other researchers can find your study through the ROSSA search interface.
Thematic Areas, Tissue Interactions, and Cell Types
The first three tabs use simple checkboxes where you can select one or more items that apply to your study. Review each tab and select all relevant options. If you cannot find an appropriate term in the preconfigured lists, you can add custom information using the "Other" option.
Disease Search
The Disease Search tab is relevant if your study involves any disease, pathological condition, or disease-related phenotype-whether modeled through genetic modification, induced through experimental interventions (such as diet, injury, or pharmacological treatment), or studied in naturally occurring disease states. If your study does not involve disease or pathology, you can skip this tab and proceed to the next section of the form.
For studies involving disease, ROSSA integrates the MONDO disease ontology-a comprehensive, widely adopted controlled vocabulary for human diseases. Using MONDO ensures consistent disease nomenclature across all ROSSA submissions and enables interoperability with other biological databases and resources.
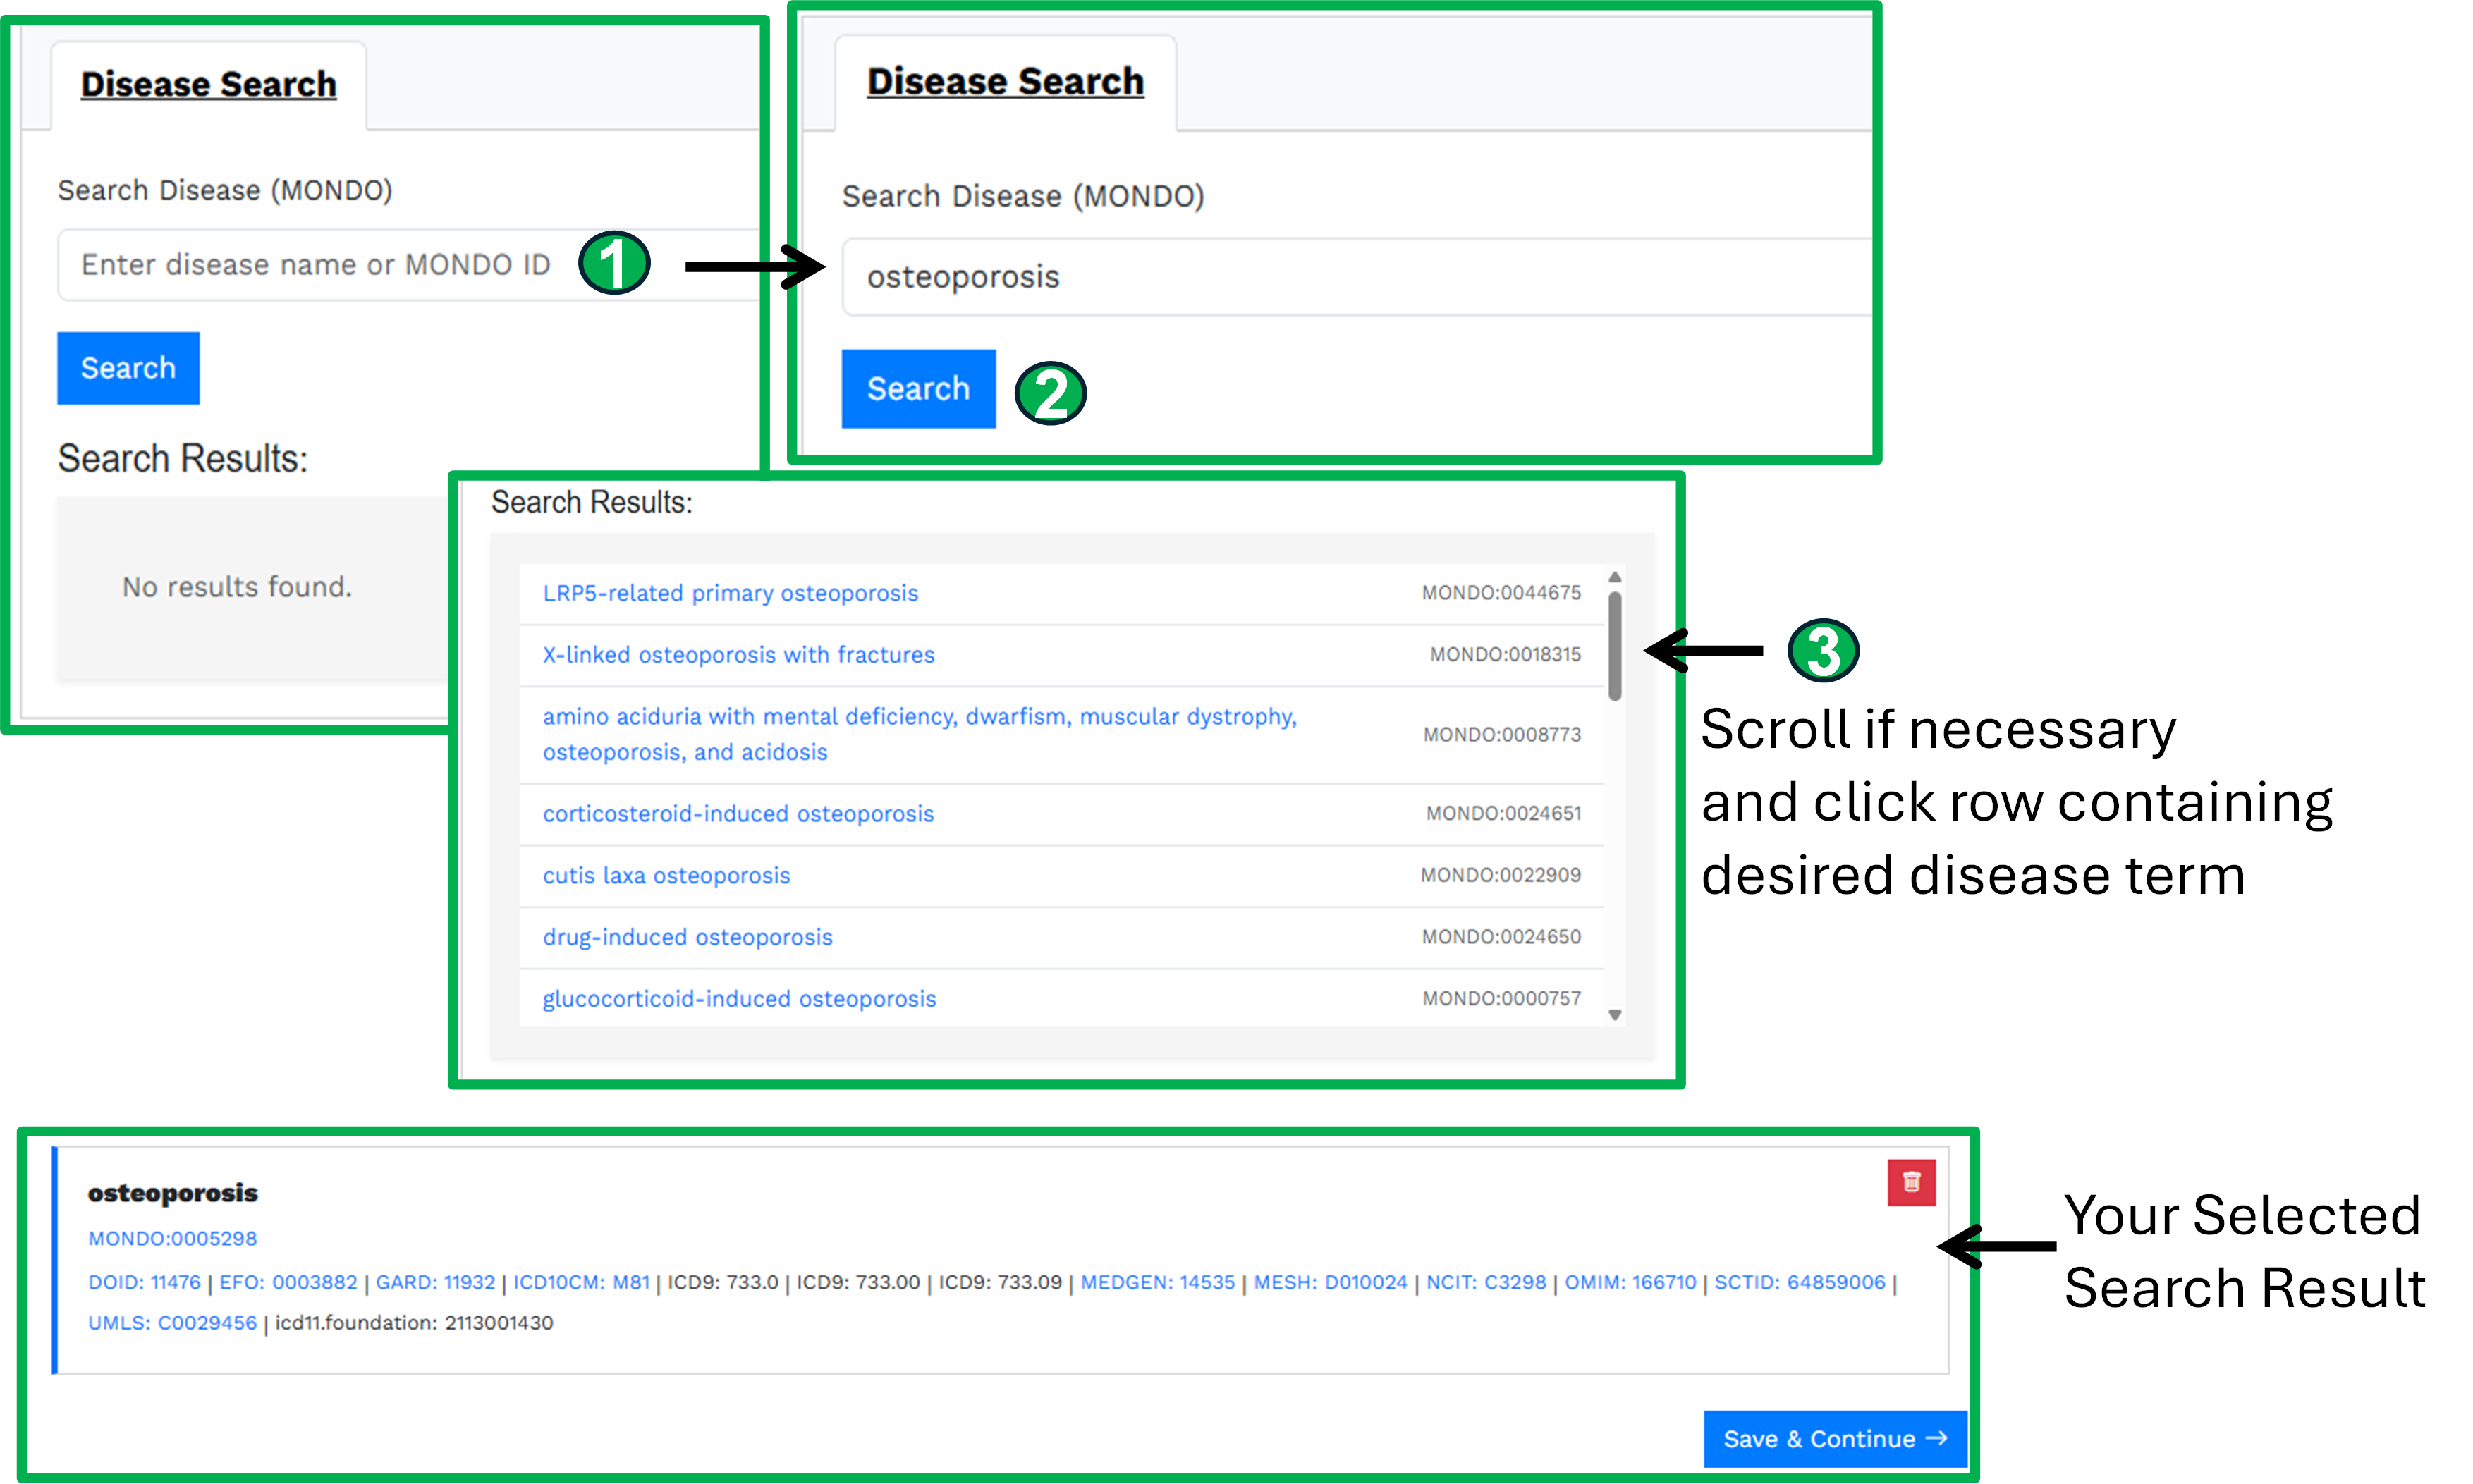
To add a disease to your study (Figure 7):
- Enter your disease term into the search field
- Click the search button
- Review the search results that appear below
- If multiple disease terms are returned, use the scroll bar to navigate through the options and select the term that best matches your animal model
Choose the most specific disease term that accurately represents your model. MONDO's hierarchical structure means that selecting a specific disease term will automatically link your study to broader disease categories as well.
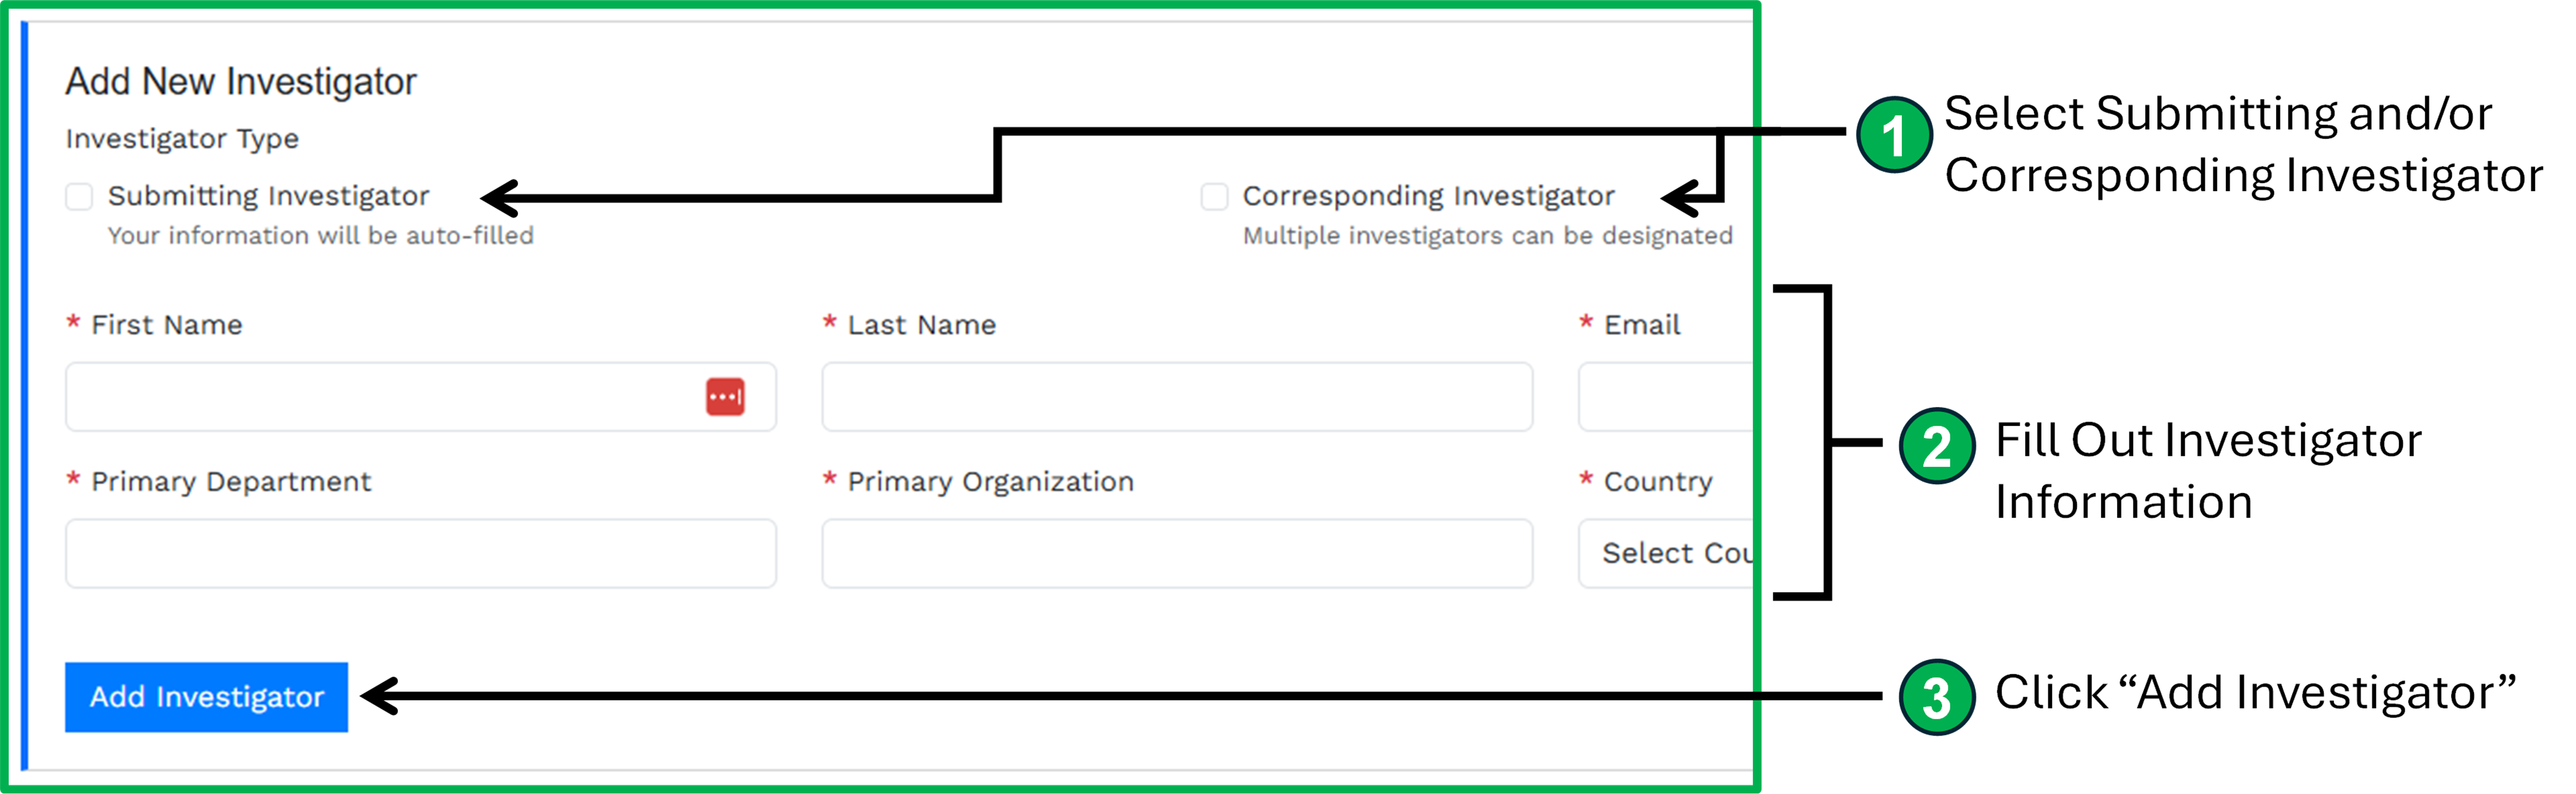
Section 3: Investigators
To minimize the burden on data submitters, ROSSA only requires investigator information for two specific roles (Figure 8):
Submitting Investigator
The person submitting the data to ROSSA and serving as the primary contact for any questions about the submission.
Corresponding Investigator
The corresponding author(s) on the published (or to-be-published) manuscript associated with this study. If your study has multiple corresponding authors, please include information for all of them.
If you are serving in both roles-both submitting the data and acting as a corresponding author-simply check both boxes while completing the investigator information fields. This will ensure you receive all relevant communications about your submission and any future inquiries about the study.
Section 4: Animal Experimentation
The Animal Experimentation section identifies the experimental variables used in your study. This information is essential for properly annotating sample groups later in the Phenotype Analysis section, ensuring that your experimental design is accurately represented in ROSSA.
Current Experimental Variables
ROSSA is currently designed to capture three major categories of experimental manipulation:
- Genetic modifications (transgenic models, knockouts, knock-ins, etc.)
- Drug treatments (pharmacological interventions)
- Gonadectomy procedures (surgical removal of gonads)
If your study involves experimental approaches outside these categories, please contact us. We are actively working to expand the types of experimental designs ROSSA can accommodate, and your input will help guide these developments.
Setup
The Animal Experimentation section begins with three yes/no questions asking whether your study involved:
- Genetically modified animals
- Drug treatment(s)
- Gonadectomy procedure(s)
Your responses to these questions will determine which subsequent data entry fields appear in this section.
Important Note
Even if you used wild-type animals with no genetic modification, you will still be asked to provide information about the animal species and strain in the Animal Models subsection. This ensures complete documentation of the biological materials used in your study.
Animal Models
The Animal Models section captures detailed information about all animal models used in your study. This includes animal species, strain background, and the specific type of genetic modification (if applicable). Providing accurate information here ensures that other researchers can properly interpret your data and compare it with related studies.
Preconfigured Animal Model Categories:
ROSSA provides several predefined categories to describe the genetic status of your animal models. Select the category that best matches each model used in your study (Figure 9):
No Genetic Modification
Use this category for studies using a specific animal strain without any genetic modifications (wild-type animals on a defined genetic background).
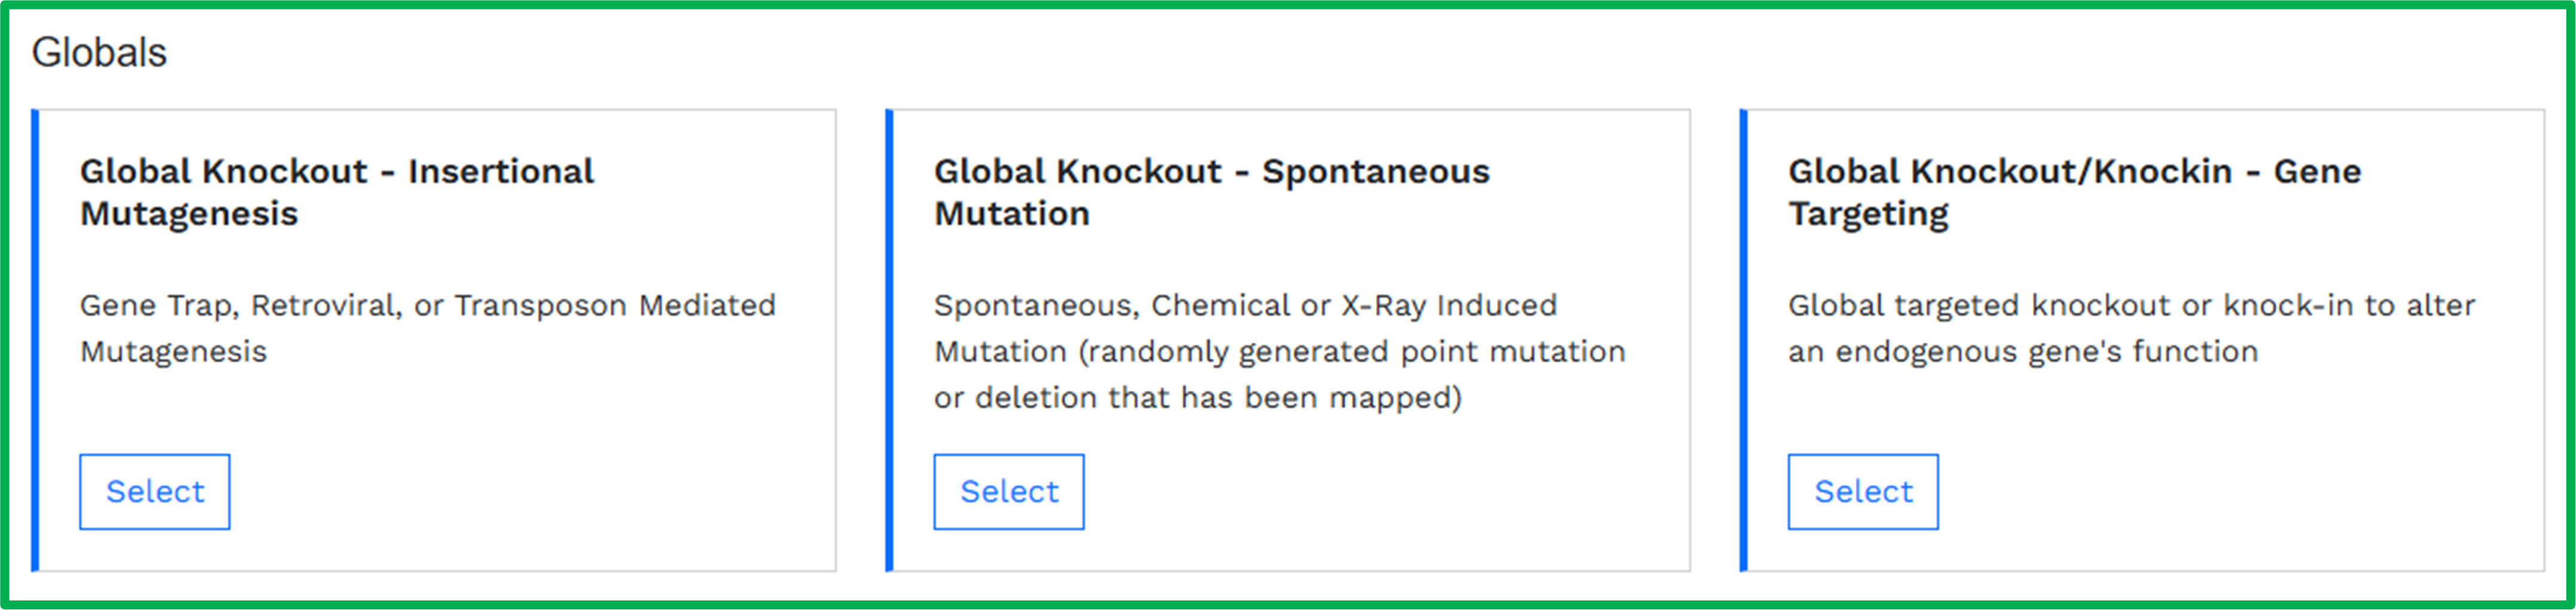
Global Modifications:
Global Knockin/Knockout - Gene Targeted: Constitutive (germline) knockout or knock-in created through targeted modification of an endogenous gene, resulting in altered gene function in all tissues throughout development and adulthood.
Global Knockout - Spontaneous Mutation: Loss-of-function allele resulting from spontaneous mutation or induced by chemical or X-ray mutagenesis. These are randomly generated point mutations or deletions that have been mapped to a specific gene.
Global Knockout - Insertional Mutagenesis: Loss-of-function allele created through random insertional disruption of an endogenous gene via gene trap, retroviral insertion, or transposon-mediated mutagenesis.
Conditional Modifications:
Conditional Knockin/Knockout: Conditional (floxed) allele that allows tissue-specific or temporal control of gene function, typically activated when crossed with a Cre recombinase transgenic line to achieve lineage-specific or inducible loss-of-function or gain-of-function.
Conditional Knockin - Safe Harbor: Conditional knock-in of a transgene into a "safe harbor" locus (such as Rosa26 or Col1a1), which allows for reliable transgene expression without disrupting endogenous gene function.
Standard Transgenic
Random genomic integration of a transgene, typically used for overexpression of a coding sequence under the control of tissue-specific or ubiquitous regulatory elements (promoter/enhancer sequences).
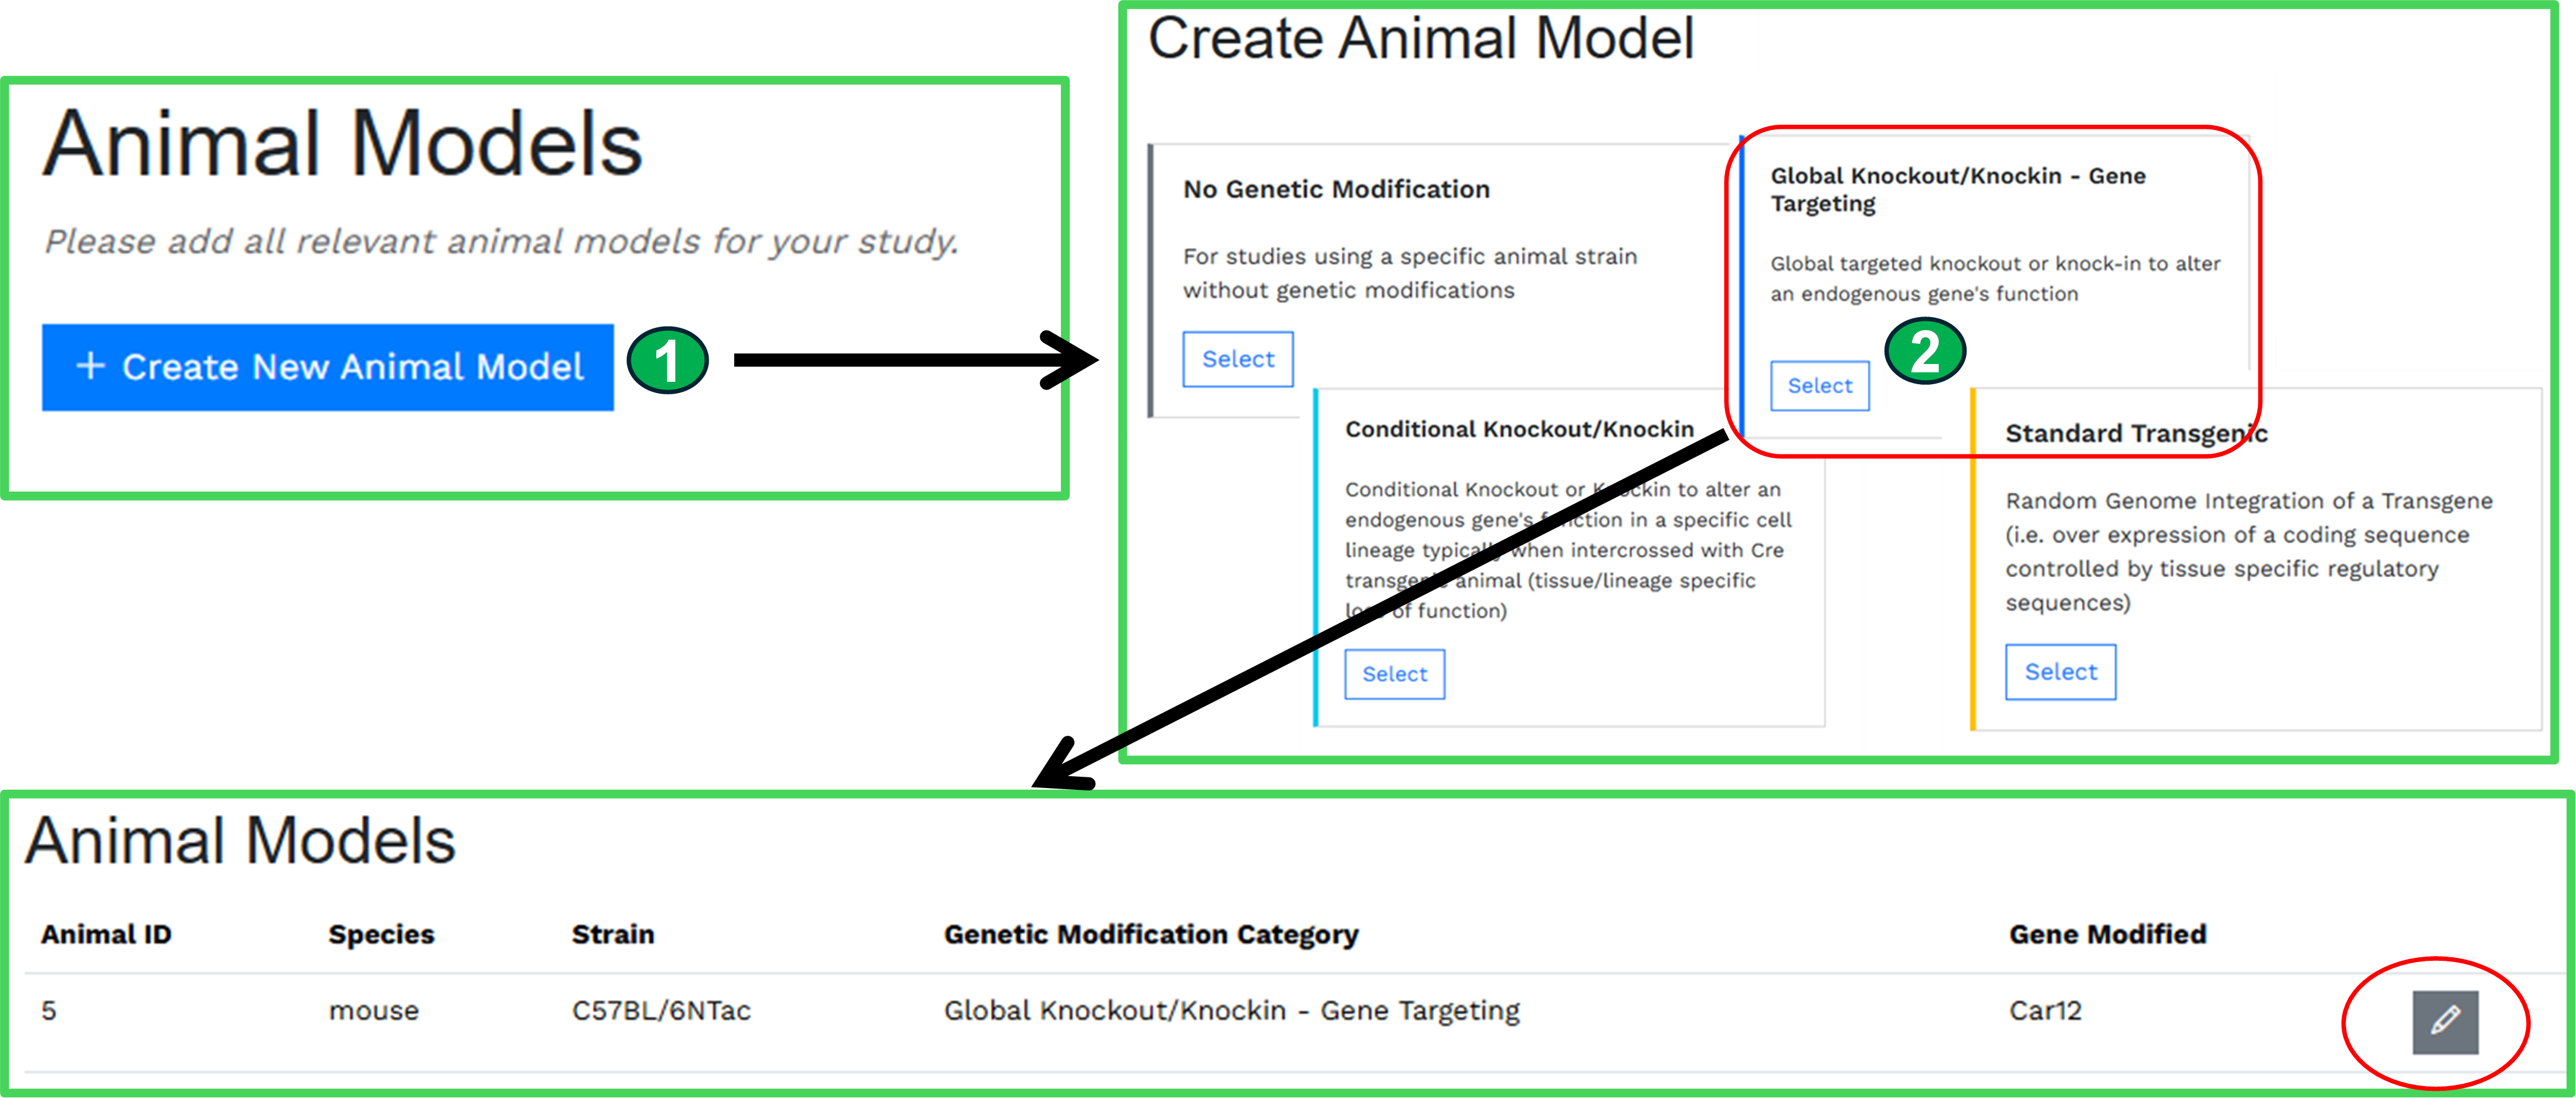
Creating Animal Models:
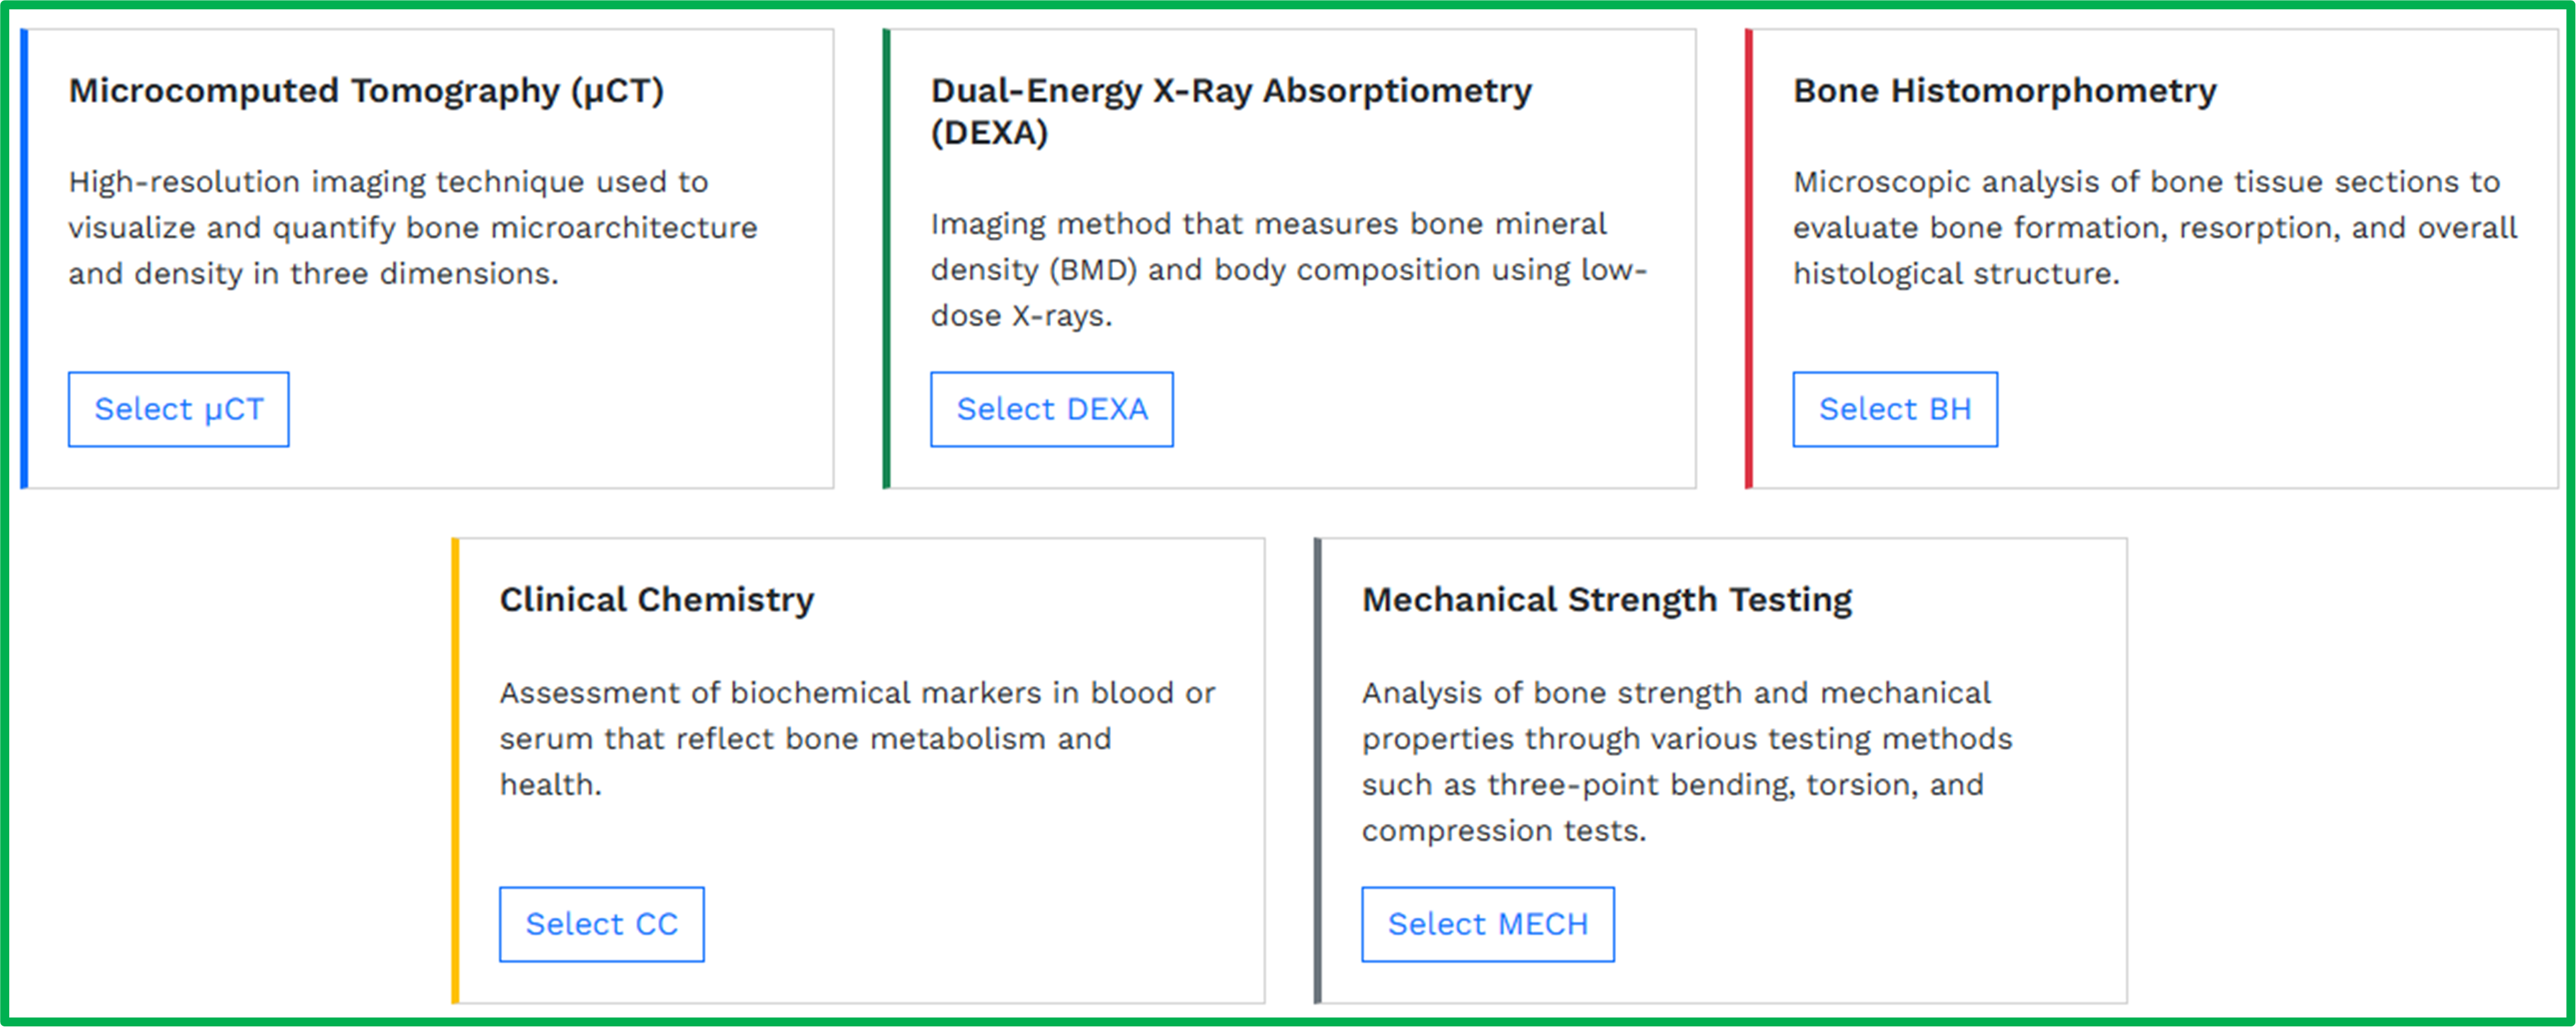
To add an animal model to your study (Figure 10):
- Click the "Create New Animal Model" button
- You will be directed to a page displaying category cards corresponding to the preconfigured animal model categories described above
- Carefully review each card and select the one that best describes your animal model
- Complete the form that appears with detailed information about your animal model
- Once submitted, your animal model will appear in the Animal Models table
Adding Multiple Animal Models
If your study involves more than one animal model, simply repeat this process for each additional model. You can create as many animal models as necessary to fully represent your experimental design.
Important Note for Conditional Models
The conditional animal model forms include built-in fields for specifying the Cre recombinase line used to activate your conditional allele. If you crossed the same conditionally engineered animal (e.g., the same floxed allele) with multiple different Cre lines, you must create a separate animal model entry for each Cre line combination. For example, if you studied Gene fl/fl crossed with both Osteocalcin-Cre and Dmp1-Cre, create two separate conditional animal model entries-one for each cross.
Drug Treatments
If your study involves the use of one or more drug treatments, check the box "Investigates the impact of a drug treatment on the skeleton" in the Setup questions. This will activate the Drug Treatments component within the form.
Drug treatments in ROSSA are documented as individual drug administration plans. Each plan represents a complete treatment regimen used in your study and can include one or more administration events. An "event" is a single drug with its specific dosing parameters (dose, route, frequency, duration). This structure allows you to capture complex treatment protocols within a single plan, including:
- Single drug treatments: One plan with one administration event
- Combination therapies: One plan with multiple simultaneous administration events (e.g., Drug A + Drug B given together)
- Sequential treatments: One plan with multiple administration events given at different timepoints (e.g., pre-treatment with Drug A, followed by Drug B)
At minimum, most studies will have two plans: (1) an experimental drug treatment plan and (2) a matching control plan. For vehicle controls, you do not need to build the second plan by hand—after creating your treatment plan, ROSSA can generate a matching vehicle control plan for you automatically (see "Generating a Vehicle Control Plan" below). Other types of controls, such as an isotype-matched antibody or a sham procedure, are created as their own plans using the same steps as any treatment plan. If your study includes multiple distinct treatment regimens (such as different dose levels of the same drug, or entirely different drug protocols), create a separate plan for each regimen.
Using the ChEMBL Database to Identify Drugs
The Drug Treatments section includes an integrated search feature that connects to the ChEMBL database-a comprehensive, manually curated repository of bioactive drug-like compounds. ROSSA uses ChEMBL for two important reasons:
- Standardized nomenclature: ChEMBL provides consistent drug names and identifiers, ensuring that the same compound is always annotated the same way across different studies
- Rich drug information: ChEMBL entries include detailed information about each compound (chemical structure, targets, mechanisms of action), which helps users better understand and contextualize your experimental treatments
If Your Drug Is Not in ChEMBL
While ChEMBL is relatively comprehensive, it does not contain every compound used in research. If you cannot find your drug using the ChEMBL search:
- Check the box labeled "I cannot find my drug in ChEMBL"
- Manually enter your drug information in the fields that appear
This ensures you can still document your drug treatments even when working with novel compounds, custom formulations, or specialized research chemicals not yet cataloged in ChEMBL.
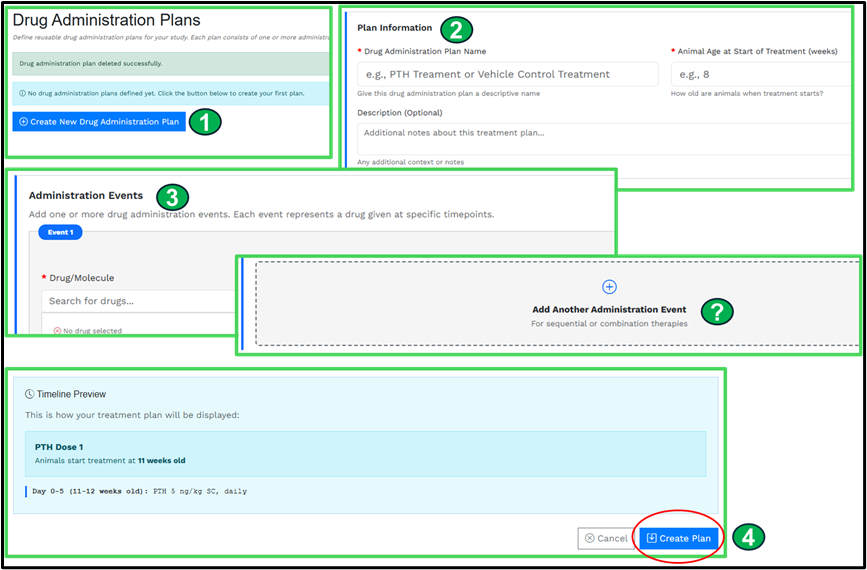
Creating a Drug Administration Plan
Step 1: Initiate a New Plan (Figure 11)
Click the blue "+ Create New Drug Administration Plan" button. This opens a form with two main sections: "Plan Information" and "Administration Events."
Step 2: Complete Plan Information
In the Plan Information section:
- Plan Name: Create a descriptive name that clearly identifies this treatment regimen. For example, if treating with parathyroid hormone (PTH), you might name your plan "PTH Treatment." The drug plan names you create will be used in future components of the form to help define sample groups.
- Treatment Start Age: Enter the age of the animals (in weeks) when this treatment regimen began.
- Description (Optional): Use this text box to provide additional context about your treatment protocol, such as the rationale for the regimen, special handling procedures, or any relevant details about the overall treatment approach.
Step 3: Add Administration Events
The Administration Events section is where you define each individual drug and its administration parameters within this treatment plan. Each event represents a single drug with its specific dosing details, but a plan can have more than one "event" if multiple drugs are used in the treatment plan.
- Drug Search: Enter the full drug name (not abbreviations) in the search box to query the ChEMBL database. If your drug appears in the search results, select it to auto-populate drug identifiers and information.
- Manual Entry: If your drug does not appear in ChEMBL search results, check the box "I cannot find my drug in ChEMBL" and manually enter the drug information in the fields provided.
- Administration Details: Complete the required fields describing the drug source, dose, route of administration, frequency, and duration for this specific drug.
- Adding Multiple Events: If your treatment plan involves more than one drug-whether administered simultaneously as a combination therapy (e.g., Drug A + Drug B given together throughout the study) or sequentially (e.g., Drug A for the first 4 weeks, followed by Drug B for the next 4 weeks)-click "Add Another Administration Event" and repeat the process for each additional drug. You can add as many events as needed to fully capture your treatment regimen within this single plan.
Step 4: Review and Create
Before finalizing your plan, review the timeline preview displayed at the bottom of the form. This visual representation summarizes key information from both the Plan Information and Administration Events sections, showing how your treatment regimen unfolds over time. Verify that the timeline accurately reflects your protocol, then click "Create Plan" to save.
Confirming and Adding Additional Plans:
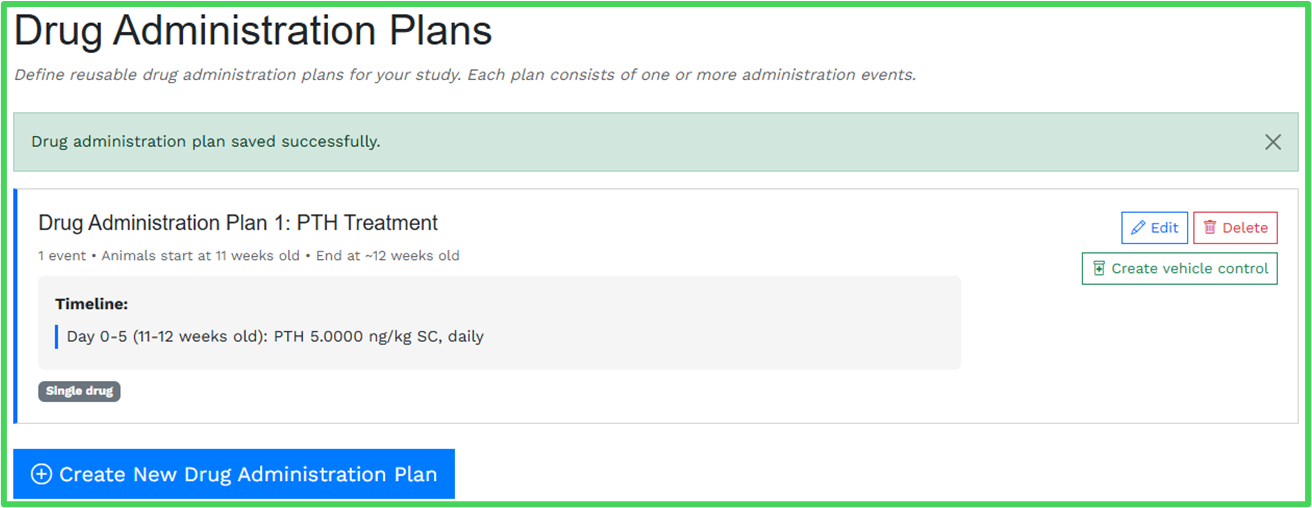
Once created, your drug administration plan will appear in the Drug Administration Plans List (Figure 12), confirming it has been successfully saved.
To create additional treatment plans for your study, click the "+ Create New Drug Administration Plan" button and repeat the process. For example, you might create separate plans for:
- Different treatment groups (e.g., high dose vs. low dose)
- Control groups that are not vehicle controls (e.g., isotype-matched antibody control, sham procedure)
- Alternative drug regimens being compared in your study
Generating a Vehicle Control Plan
For vehicle controls, you do not need to recreate the regimen by hand. On the Drug Administration Plans List, each treatment plan that has vehicle information recorded displays a "Create vehicle control" button (Figure 12). Clicking it generates a new plan that mirrors the original—same animal age, route, frequency, schedule, and administration volume—but with the active drug removed, leaving only the vehicle. If two drugs in a plan share the same vehicle, route, and schedule, they are combined into a single control event, reflecting how a vehicle control would actually be administered.
Once generated, the vehicle control appears as its own plan in the list, labeled with a "Vehicle control" badge and linked back to the treatment plan it controls. The original treatment plan's button is replaced by an indicator showing which plan its vehicle control is. The generated plan is fully editable, so you can adjust its name or details through the Edit button if needed. Because the generator only produces vehicle controls, you remain free to add other control types (such as an isotype control) as separate plans.
All drug administration plans you create will be stored and made available later in the form when you define the specific sample groups that underwent phenotypic analysis. This allows you to assign the appropriate treatment history to each group of animals measured in your study.
Gonadectomy Procedure
If your study involves a gonadectomy procedure, check the box "Performs a gonadectomy" in the Setup questions. This will activate the Gonadectomy Procedure component within the form.
Adding a Gonadectomy Procedure:
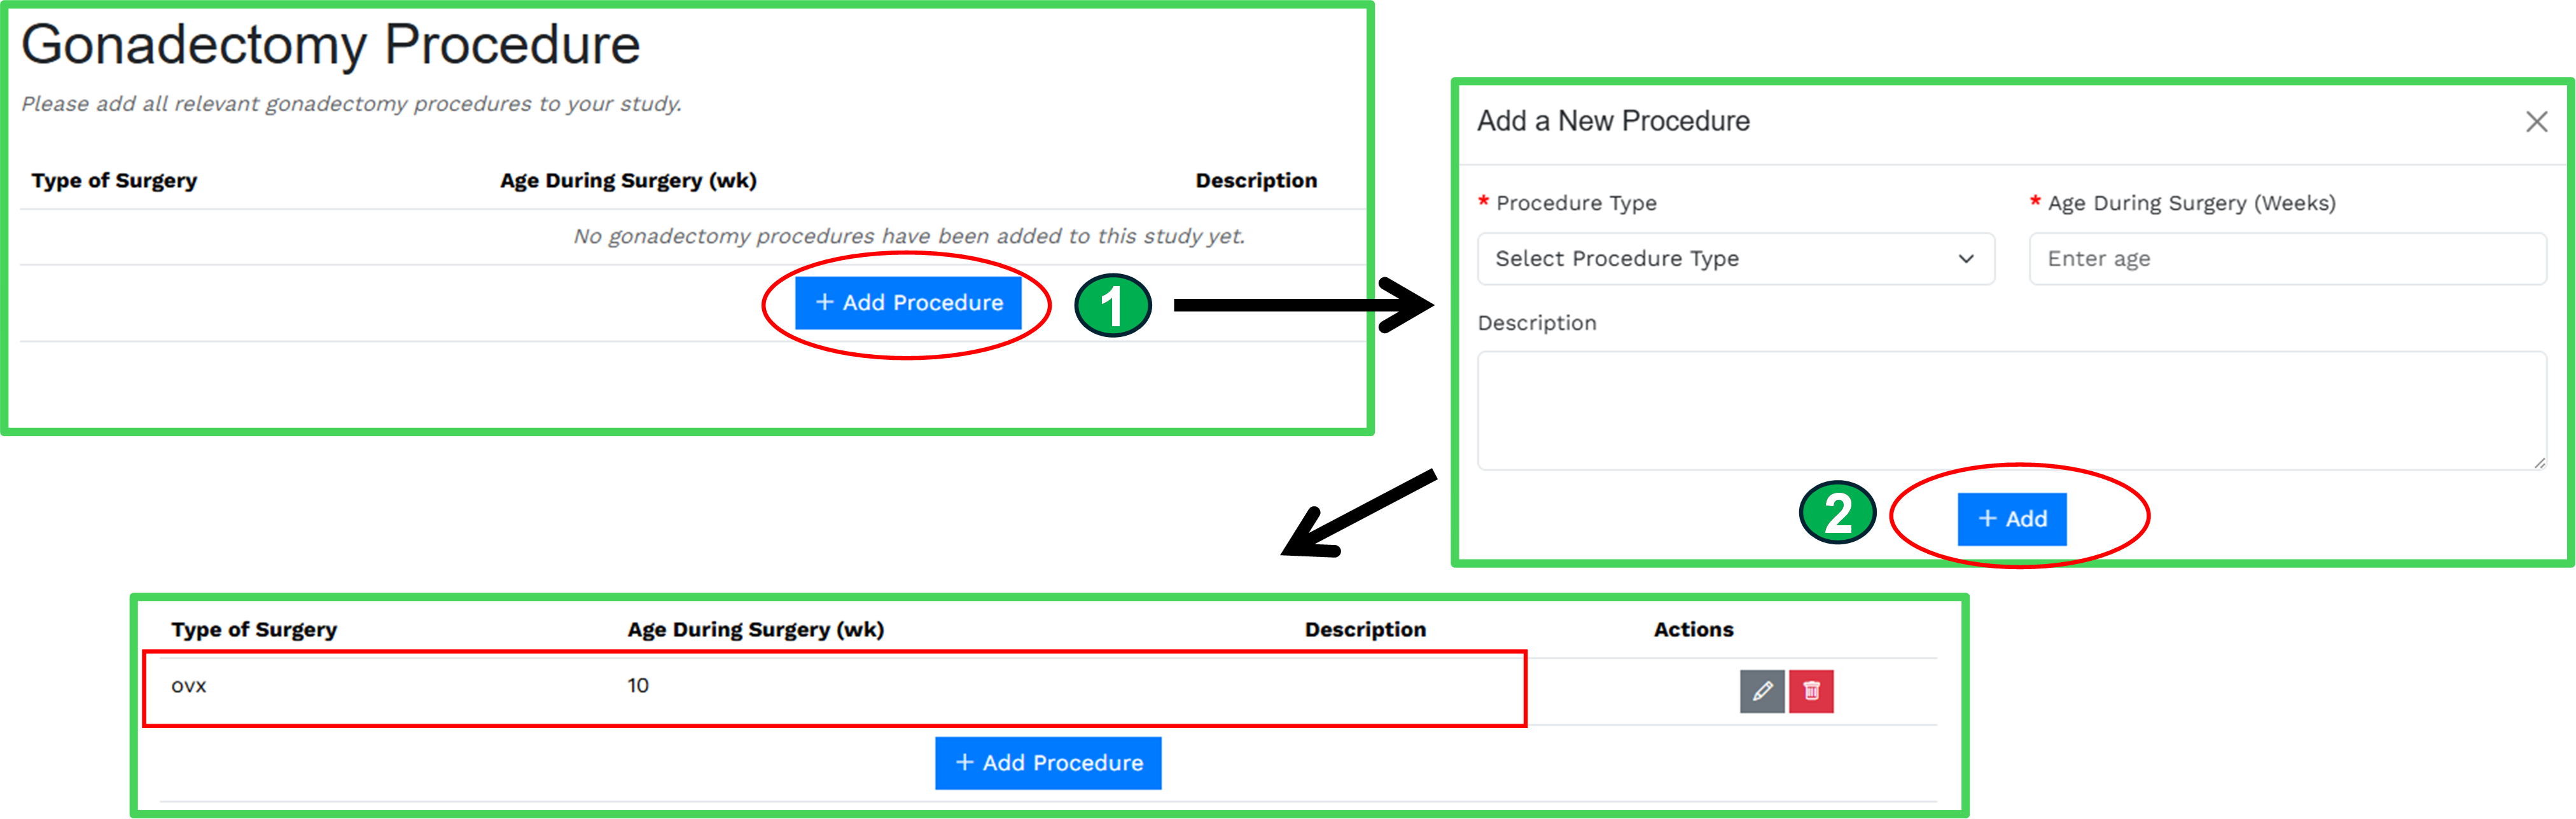
To create a gonadectomy procedure entry (Figure 13), click the "+ Add Procedure" button. This opens a window with three fields:
- Procedure Type (required): Select from the dropdown menu:
- Ovariectomy: Surgical removal of ovaries
- Orchiectomy: Surgical removal of testes
- Sham Surgery: Control procedure involving anesthesia and incision without gonad removal
- No Surgery: Control group with no surgical intervention
- Age at Surgery (required): Enter the age of the animals (in weeks) at the time the procedure was performed.
- Description (optional): Use this text box to provide additional details about the surgical procedure, such as anesthesia protocols, post-operative care, recovery time, or any relevant procedural notes.
Once you have completed these fields, click the "+ Add" button to save the procedure. It will then appear in the Gonadectomy Procedures table.
Adding Multiple Procedures:
If your study includes multiple gonadectomy groups (for example, surgery at different ages, or both ovariectomy and sham control groups), click the "+ Add Procedure" button below the table and repeat the process for each additional procedure group. All procedures you create will be available later in the form when you define the sample groups that underwent phenotypic analysis.
Section 5: Phenotype Analysis
The Phenotype Analysis section (1) defines your sample groups, (2) determines what groups will be compared to each other, and (3) uploads your spreadsheet data for those animal groups.
- Sample Groups: Define distinct experimental groups by combining your variables (genotype, sex, age, drug treatment, surgical intervention)
- Comparison Groups: Organize sample groups into comparisons that reflect your experimental design and statistical analysis plan
- Data Upload: Associate individual animal measurements from your spreadsheet with their corresponding sample groups
The sample groups and comparison groups you create here form the foundation for statistical analysis and data visualization in the Report section of the form.
Sample Groups
Sample groups represent the distinct experimental cohorts in your study. Each sample group is defined by a unique combination of:
- Animal model (genotype/strain)
- Sex
- Age at phenotyping (in weeks)
- Drug treatment plan (if applicable)
- Gonadectomy procedure (if applicable)
For example, your study might include sample groups such as "8-week-old male wild-type mice treated with vehicle" and "8-week-old male knockout mice treated with PTH." By creating well-defined sample groups, you ensure that individual animal data from your spreadsheets can be accurately linked to the correct experimental conditions during data upload.
Creating Sample Groups
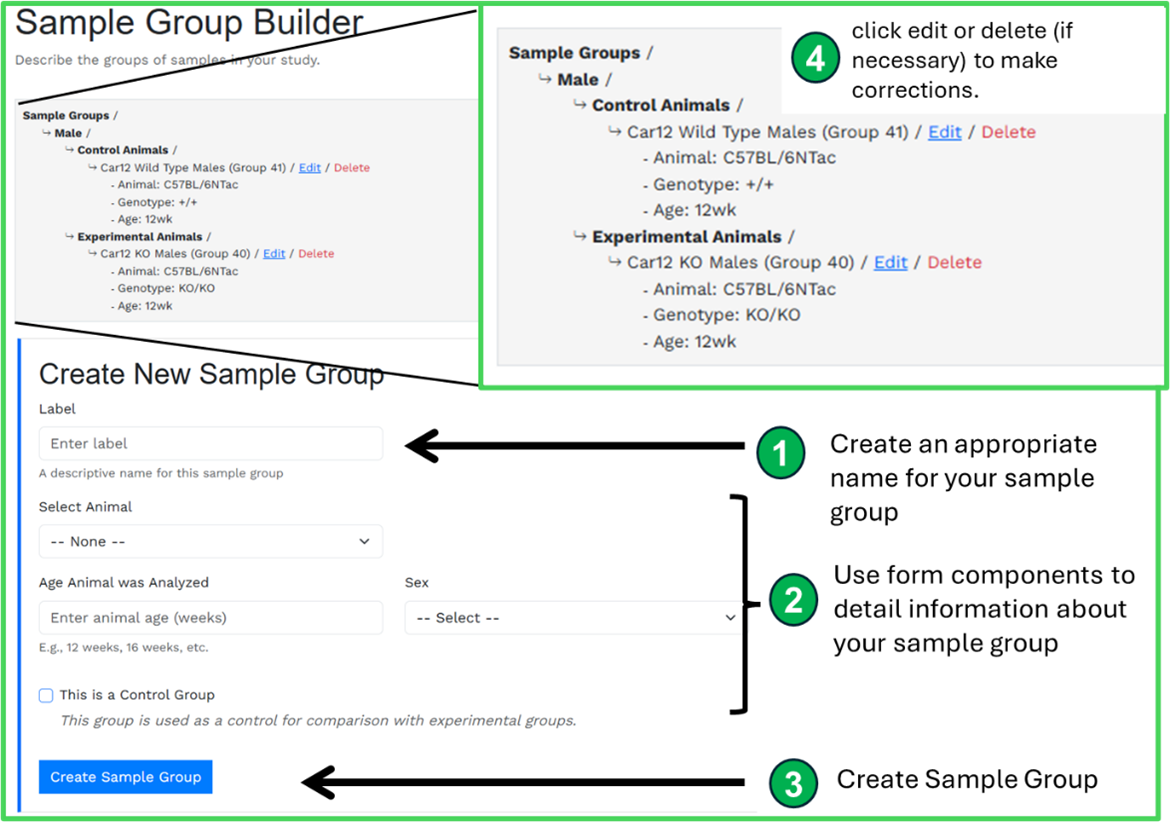
The Sample Group Builder (Figure 14) combines a short form which exists below a tree diagram that visually tracks your selections as you build each sample group. This tree structure helps you:
- Navigate through the required variables systematically
- See all created sample groups at a glance
- Edit existing sample groups if you need to correct any information
- Ensure you've created all necessary groups before proceeding to data upload
Comparison Groups
After defining your sample groups, you need to specify which groups should be compared to each other in your analysis. Comparison groups define the structure of your statistical comparisons and determine how data will be displayed in your study report.
Creating a Comparison Group
To create a comparison group, click the "+ Create New Comparison Group" button. This opens an interface with two panels:
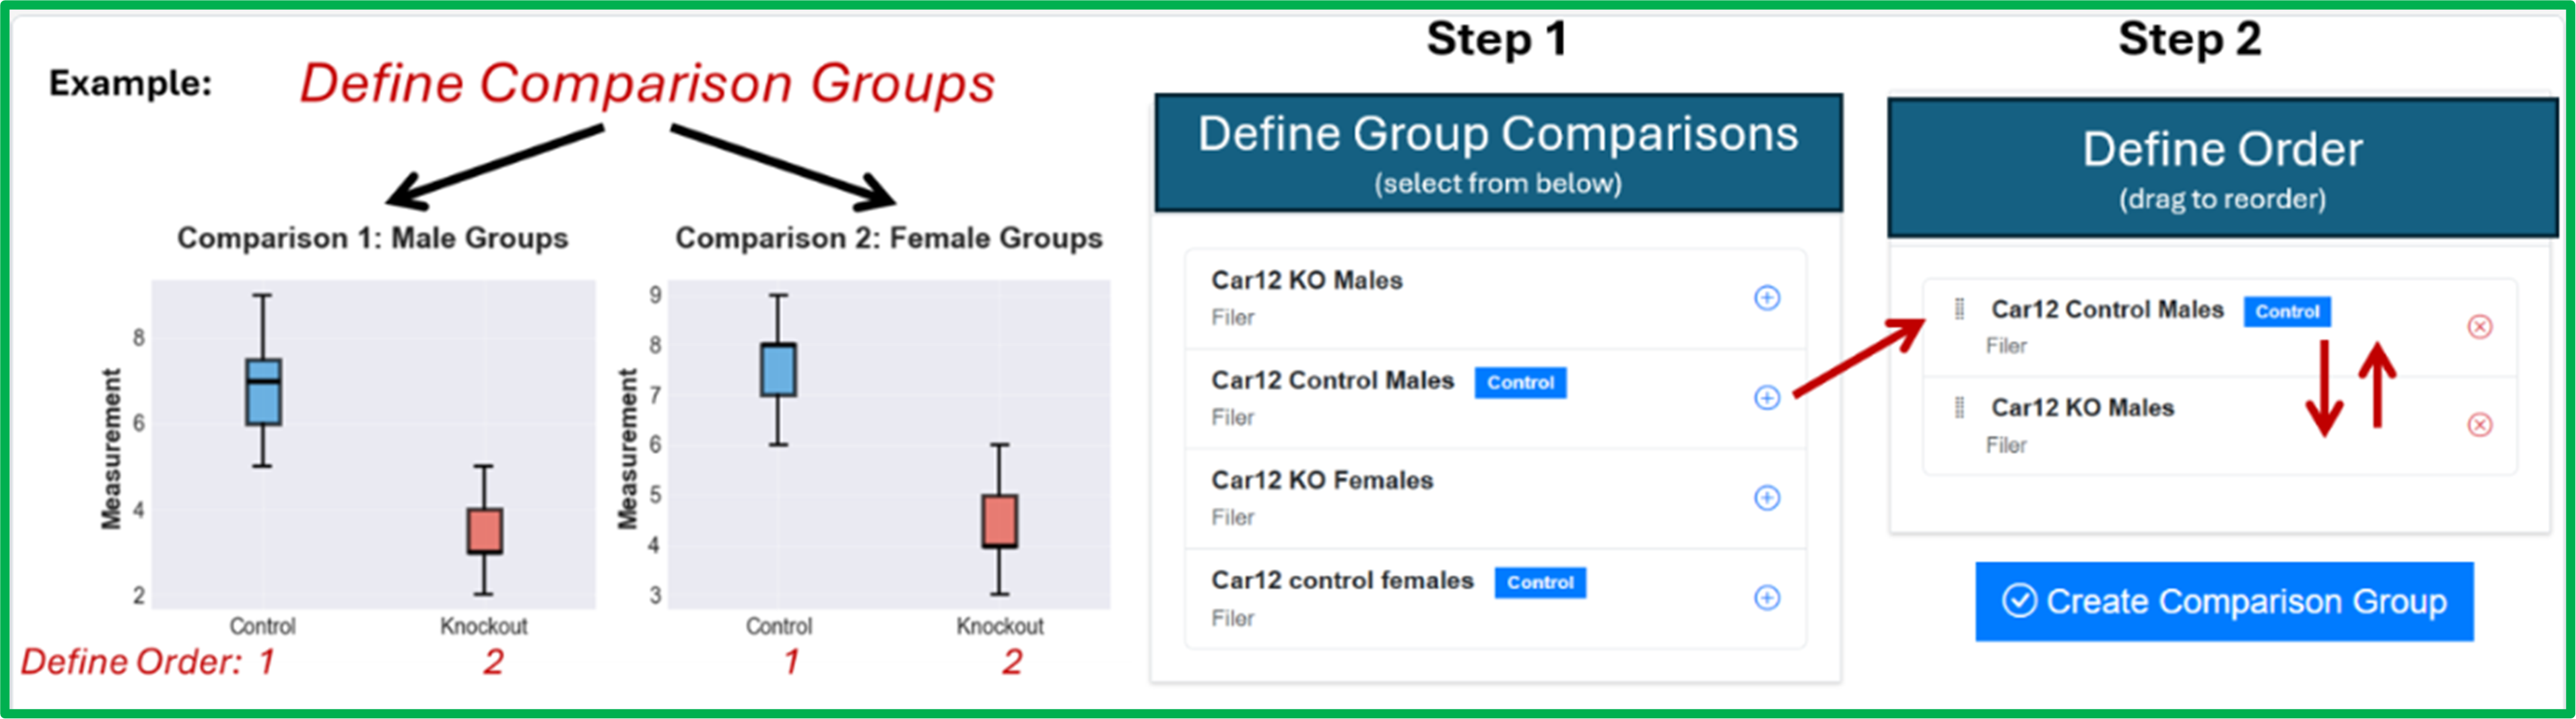
Left Panel - (Figure 15, Step 1) Select two or more groups you would like to compare: All sample groups you've created are listed here. Review the list and click on each sample group you want to include in this comparison. For example, you might select both wild-type male and knockout male as one group and wild-type female, and knockout female as a second group.
Right Panel - Order Selected Groups: The subset of sample groups you selected from the left panel will now appear in the right panel. You can define the specific order of these groups by clicking and dragging up or down. The order of groups determines the left-to-right order in which groups will appear in plots and the sequence used for statistical comparisons (see Figure 15 for an example). Arrange them in the order that makes the most sense for your analysis. For instance, you might order them as: wild-type vehicle, wild-type drug, knockout vehicle, knockout drug-grouping by genotype first, then treatment.
Finalizing the Comparison: Once you've selected your sample groups and arranged them in your desired order, click the blue "Create Comparison Group" button. This saves your comparison and returns you to the Comparison Groups table.
Creating Multiple Comparisons: You can create as many comparison groups as needed for your study. Comparison groups are not limited to two sample groups-you can include as many groups as necessary to represent your experimental design. For example, you might create separate comparisons for:
- Males only: Wild-type male, knockout male
- Females only: Wild-type female, knockout female
- Drug treatment across genotypes: Wild-type vehicle, wild-type drug, knockout vehicle, knockout drug (four groups in one comparison)
- Dose response: Wild-type control, wild-type low dose, wild-type medium dose, wild-type high dose (four groups in one comparison)
The flexibility to include multiple groups in a single comparison allows you to capture complex experimental designs and visualize all relevant conditions side-by-side in your plots and statistical analyses.
To add another comparison group, click the "+ Create New Comparison Group" button again and repeat the process. Each comparison group you create will be available for statistical analysis and visualization in the Report section.
Upload Data
The Upload Data component accepts spreadsheet data in CSV file format. ROSSA is designed to directly read your spreadsheet files with minimal reformatting, but there is one critical requirement: you must include "Sample Name" as a column header in the same row as your measurement parameter headers (see Figure 16). This column should contain your unique sample identifiers (animal IDs) that will be used to link each row of data to the appropriate sample group.
Supported Analysis Types:
ROSSA currently accepts the following skeletal phenotyping data types:
- Microcomputed Tomography (uCT)
- Dual-Energy X-Ray Absorptiometry (DXA)
- Bone Histomorphometry
- Mechanical Strength Testing
- Clinical Chemistry
To begin uploading data, click the "Upload New Analysis" button. This takes you to a page displaying cards for each analysis type. Select the card corresponding to your data type to begin the upload process. Depending on the analysis type selected, you will be asked to provide some minimal essential information (such as anatomical site or testing parameters) in addition to uploading your CSV file.
Body Weight Data: Because body weight is a crucial parameter in skeletal phenotyping,
The Three-Step Upload Process
The upload workflow consists of three steps: (1) Map Measurements, (2) Group Samples, and (3) Review Data.
Step 1: Map Measurements
(Figure 17) To streamline data ingestion, ROSSA automatically attempts to match the column headers in your spreadsheet to preconfigured measurement parameters in the database. Your task is to verify and correct these mappings:
- Correctly mapped parameters display a green checkmark () next to them
- Unmapped or incorrectly mapped parameters display a yellow warning triangle (!) next to them
For any unmapped measurements, use the dropdown menu to select the correct measurement parameter from ROSSA's standardized list. If your measurement is not available in the dropdown, check the "Custom" box to add it manually (Figure 17).
Note: Your spreadsheet may contain columns that are not measurement parameters (such as notes, dates, or other metadata). These do not need to be mapped for successful data ingestion-simply leave them unmapped.
Once all relevant measurement parameters have been correctly mapped, click the "Save Column Mapping and Continue" button.
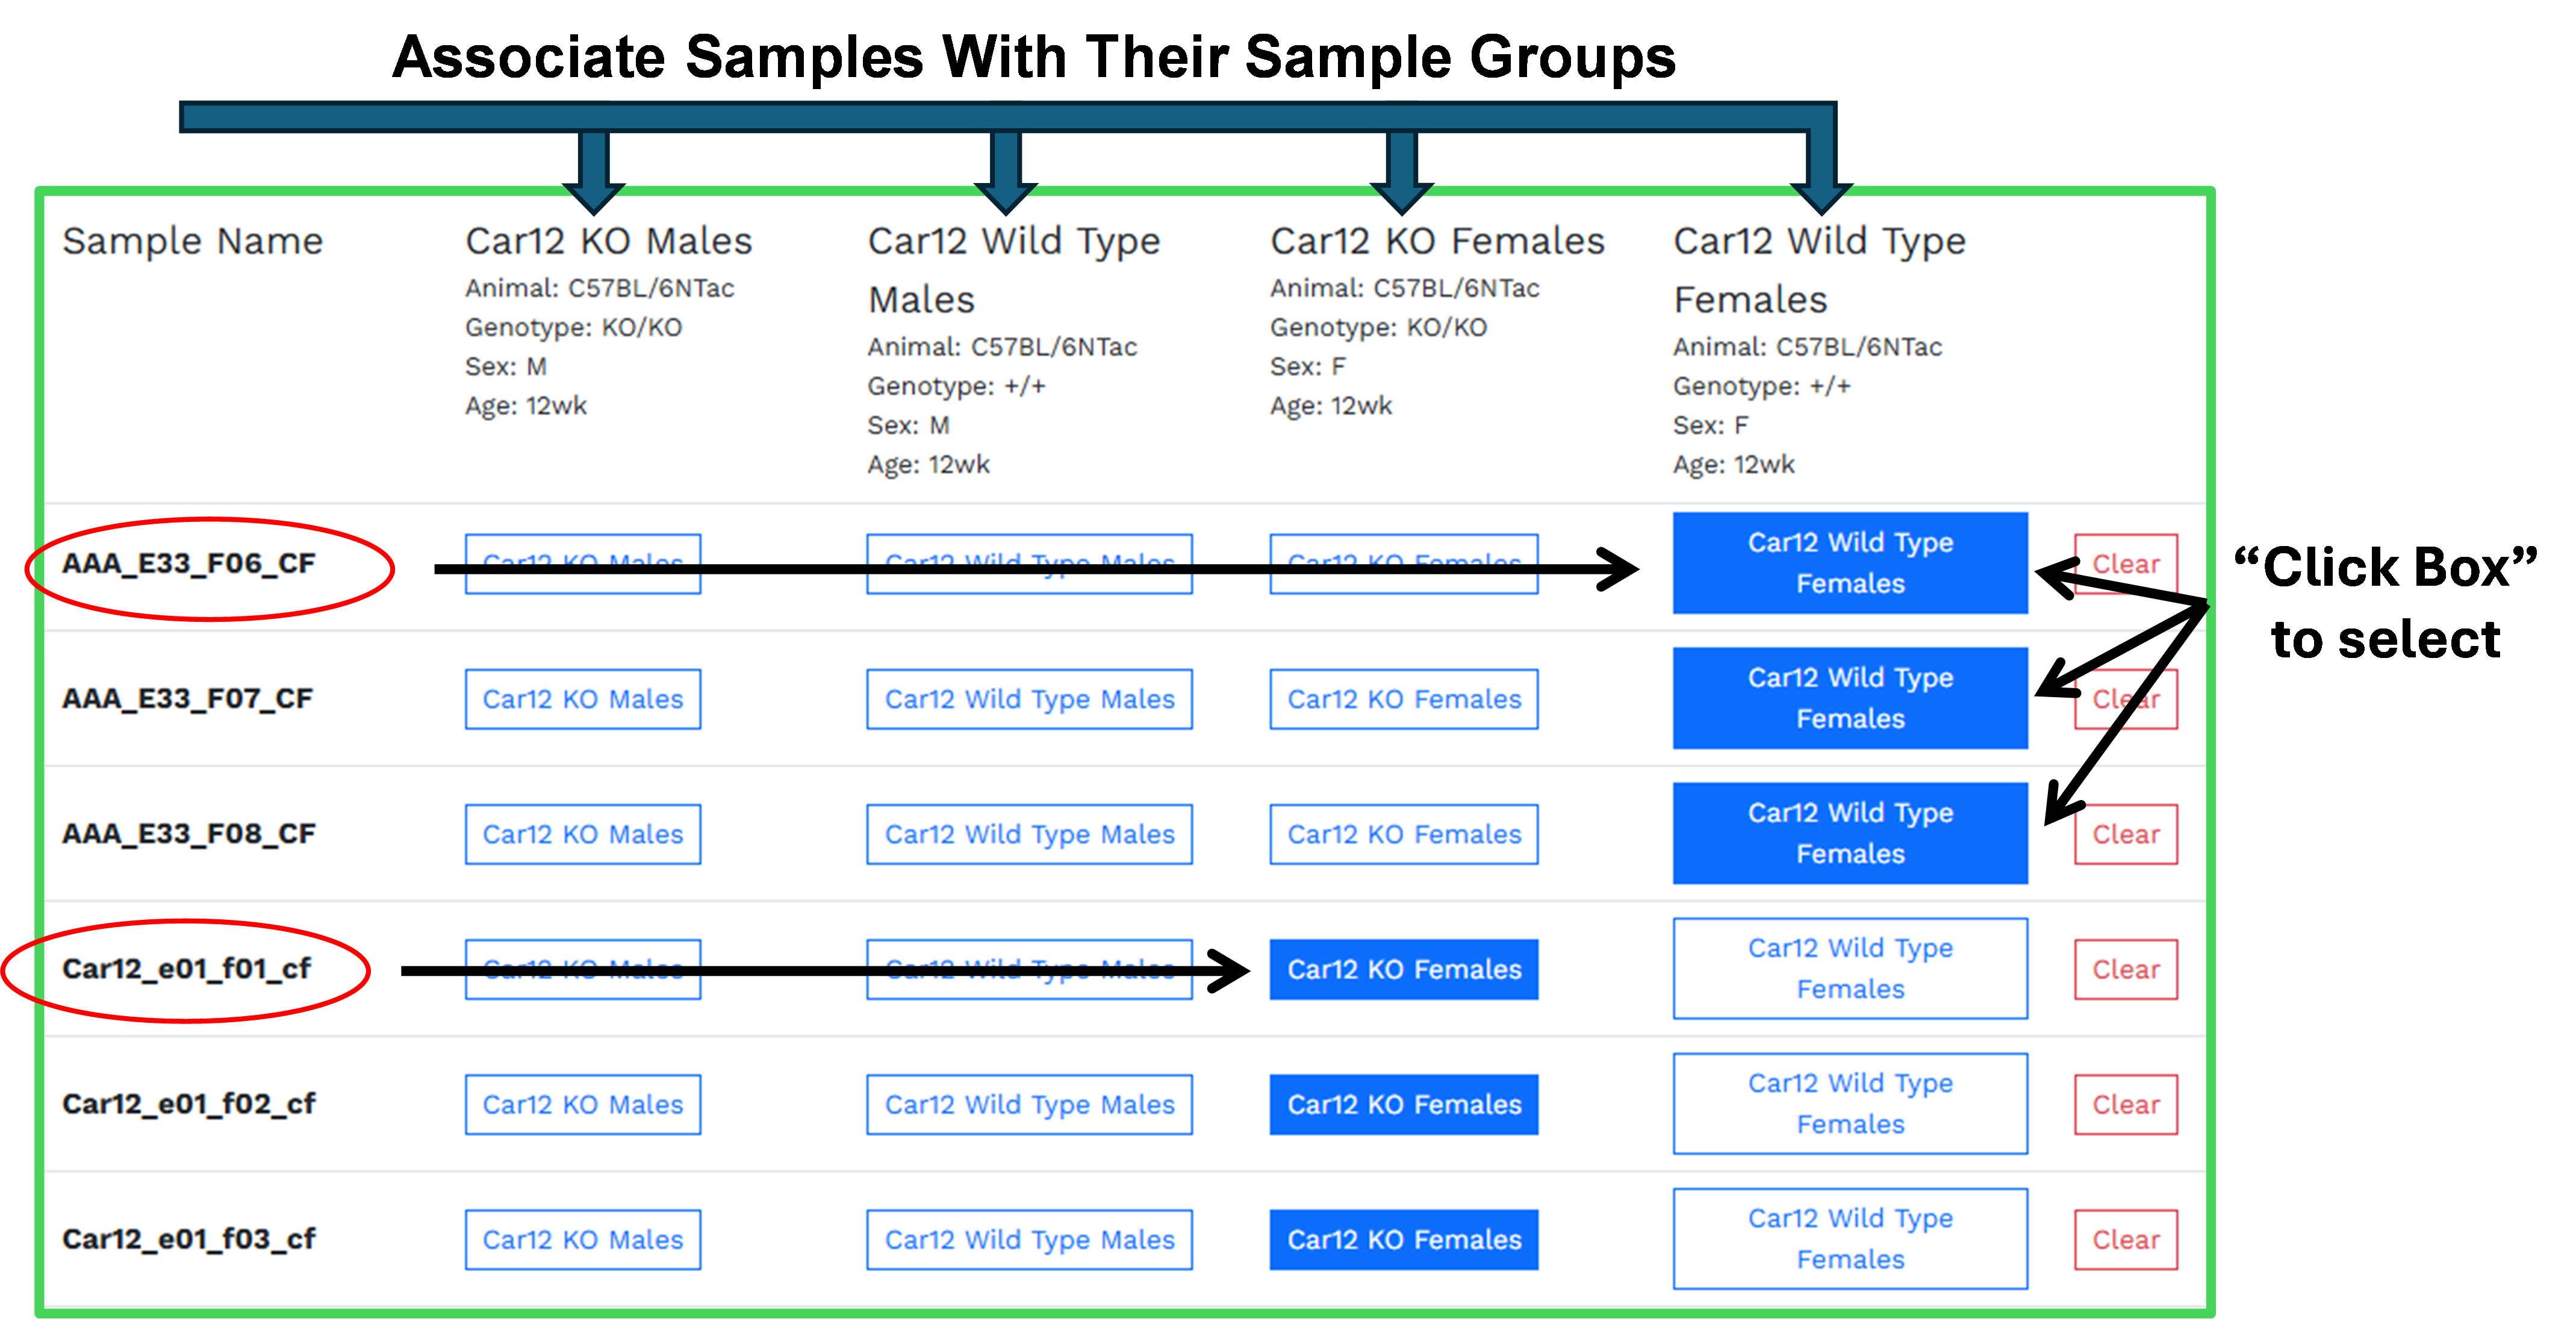
Step 2: Group Samples:
(Figure 18) In this step, you associate each individual sample (Under Sample Name) with its corresponding sample group. The interface displays:
- Left column: Your sample names (animal IDs) from your spreadsheet, listed vertically
- Right columns: The sample groups you created earlier in the form
Work down the list row by row, clicking the appropriate sample group button for each sample. When selected, the button will turn from white to blue (Figure 18). This links each animal's data to the correct experimental conditions (genotype, sex, age, treatment, etc.).
Once all samples have been assigned to their respective sample groups, click the "Save Groups & Review Samples" button.
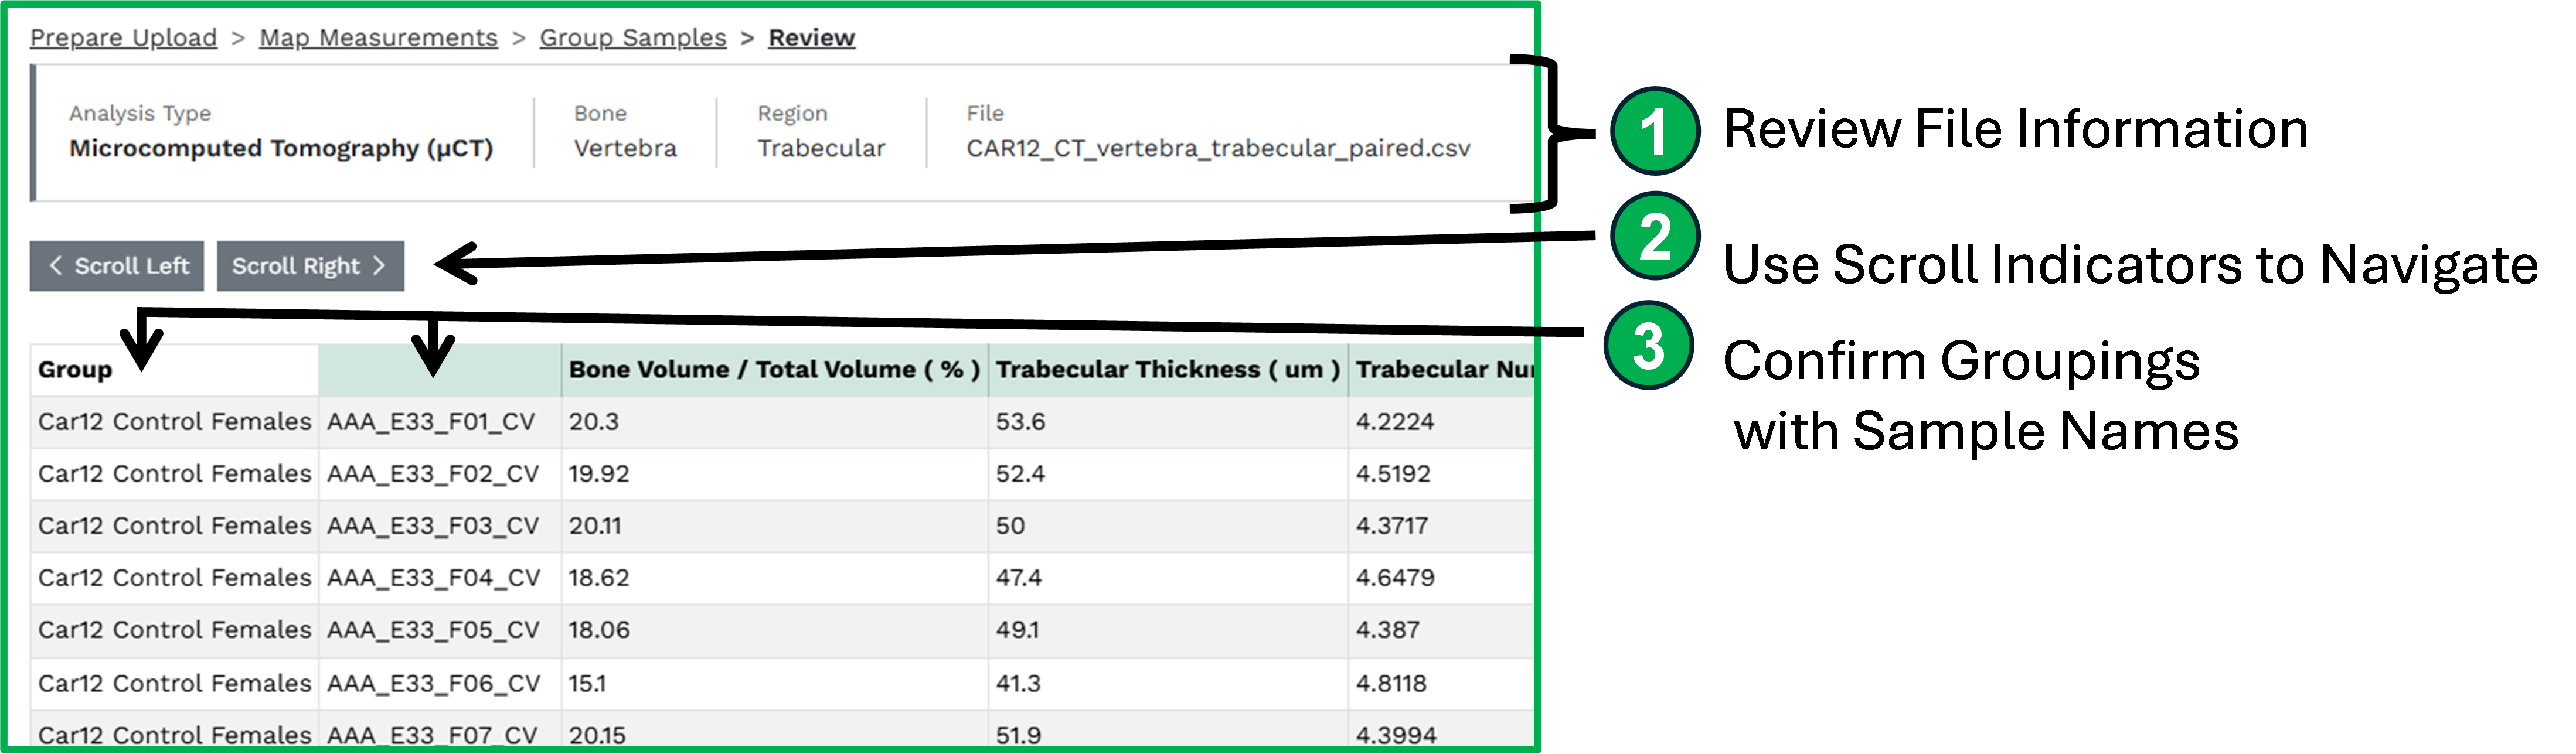
Step 3: Review the Ingested Spreadsheet Data
(Figure 19)The final step displays your uploaded data in a table format. Scroll both vertically and horizontally to verify that:
- All measurements were imported correctly
- Sample assignments are accurate
- Values appear as expected
If you notice any problems, use the navigation buttons (Prepare Upload > Map Measurements > Group Samples > Review) to return to previous steps and make corrections.
If everything looks correct, click the "Finalize Upload" button, then confirm by clicking "Confirm & Finalize."
Confirming Upload and Adding Additional Data:
After clicking "Confirm & Finalize," information about your uploaded dataset will appear in the Phenotype Analysis table (Figure 20). This confirms your data has been successfully ingested.
To upload additional phenotyping data (for example, a different analysis type or data from a different anatomical site), click the "Upload New Analysis" button and repeat Steps 1-3. You can upload as many datasets as needed to fully represent the phenotypic analyses performed in your study.

Section 6: Report
At the end of the data ingestion process, ROSSA automatically generates a comprehensive report containing critical information about your study. This report is what will be publicly shared with the broader research community, so it's important to review it carefully before finalizing your submission. The report is organized into three tabs: Study Information, Data Exploration, and Download Original Data.
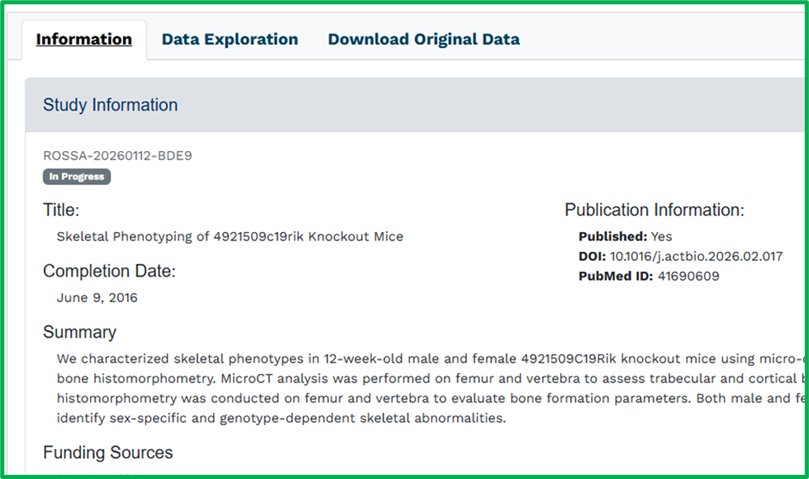
Tab 1: Study Information
The Study Information tab (Figure 21) provides a complete overview of your study, organized into the following sections:
- General Study Details: Study title, publication information (DOI and PubMed ID), completion date, study summary, funding sources, and conflicts of interest
- Subject Areas: The thematic areas, tissue interactions, cell types, and disease types you annotated during the submission process
- Investigators: Information about the submitting investigator and corresponding author(s)
- Experimental Design: Details about the animal models used in your study, including genotype/strain information, and descriptions of any drug treatments or gonadectomy procedures performed
Making Edits: Each section on the Study Information tab includes a pencil icon that allows you to quickly navigate back to the corresponding section of the form to make edits if you notice any errors or want to update information.
This tab serves as the primary reference for researchers wanting to understand the context and design of your study.
Tab 2: Data Exploration
The Data Exploration tab (Figure 22) provides interactive access to your phenotyping data with built-in statistical analysis and visualization tools:
Data Selection Panel (top left): A list of all datasets you uploaded (e.g., uCT femur, uCT vertebra, mechanical testing), selectable via radio buttons. Selecting a dataset loads its measurements for analysis.
Comparison Groups Panel (top right): Displays the comparison groups you created during submission, showing which sample groups are being compared in your study. This panel is informational-it shows users how you structured your experimental comparisons.
Statistics Tables and Plots: ROSSA automatically generates statistical tables and box plots for all comparison groups you created.
Statistics Table Layout:
- Comparison Group Tabs (top left of table): Switch between different comparison groups to view their respective statistics
- Action Buttons (top right of table):
- CSV Download: Export the current statistics table
- Statistics: Return to table view (if currently viewing plots)
- Box Plots: Switch the entire display to show box plots for all measurements, replacing the table view
Statistics Table Content: Displays descriptive statistics (mean and standard deviation) for each sample group within the selected comparison group, along with:
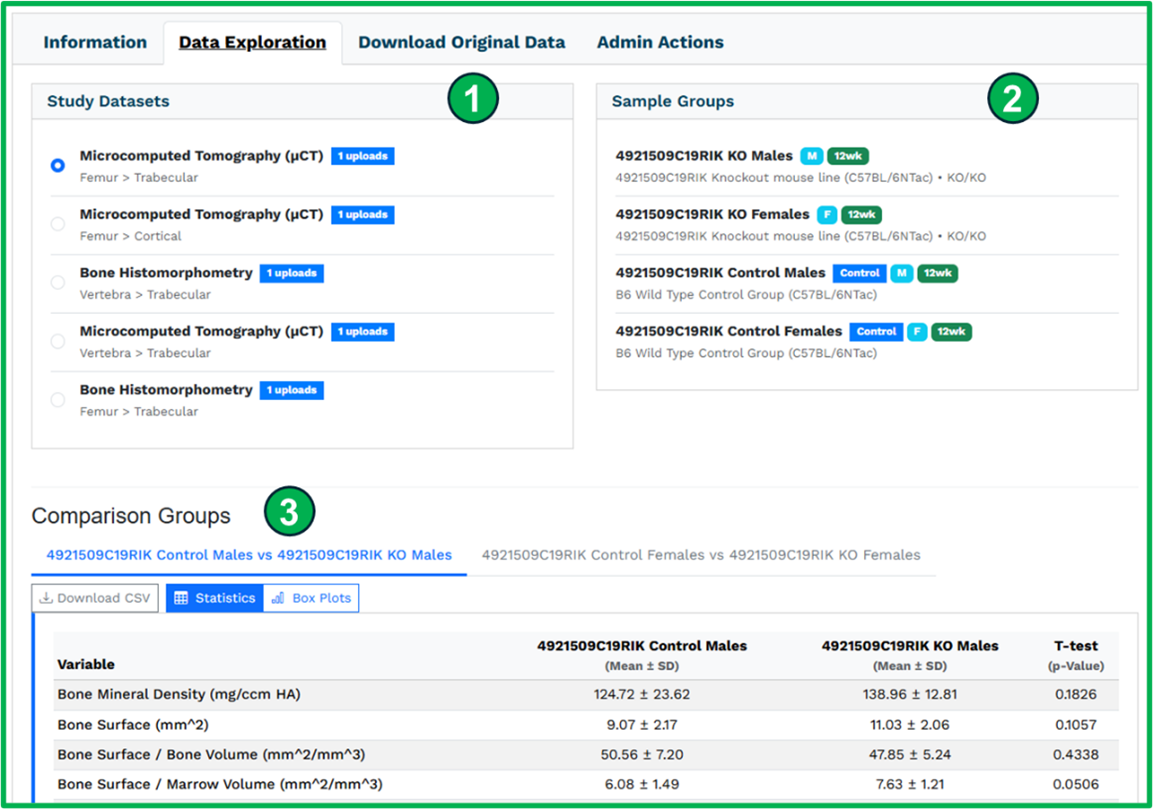
- Automatic statistical testing: When comparing two groups, an independent t-test is performed. When comparing three or more groups, ANOVA with Tukey's post-hoc test is performed to identify significant differences between groups.
Viewing Box Plots: There are two ways to view box plots:
- Individual measurement view: Click on any row in the statistics table to open a modal window displaying a box plot for that specific measurement parameter. Use the forward and back navigation buttons within the modal to advance through measurements. Box plots can be downloaded as PNG images.
- All plots view: Click the "Box Plots" button in the top right of the table to replace the table view with box plots for all measurements in the selected comparison group.
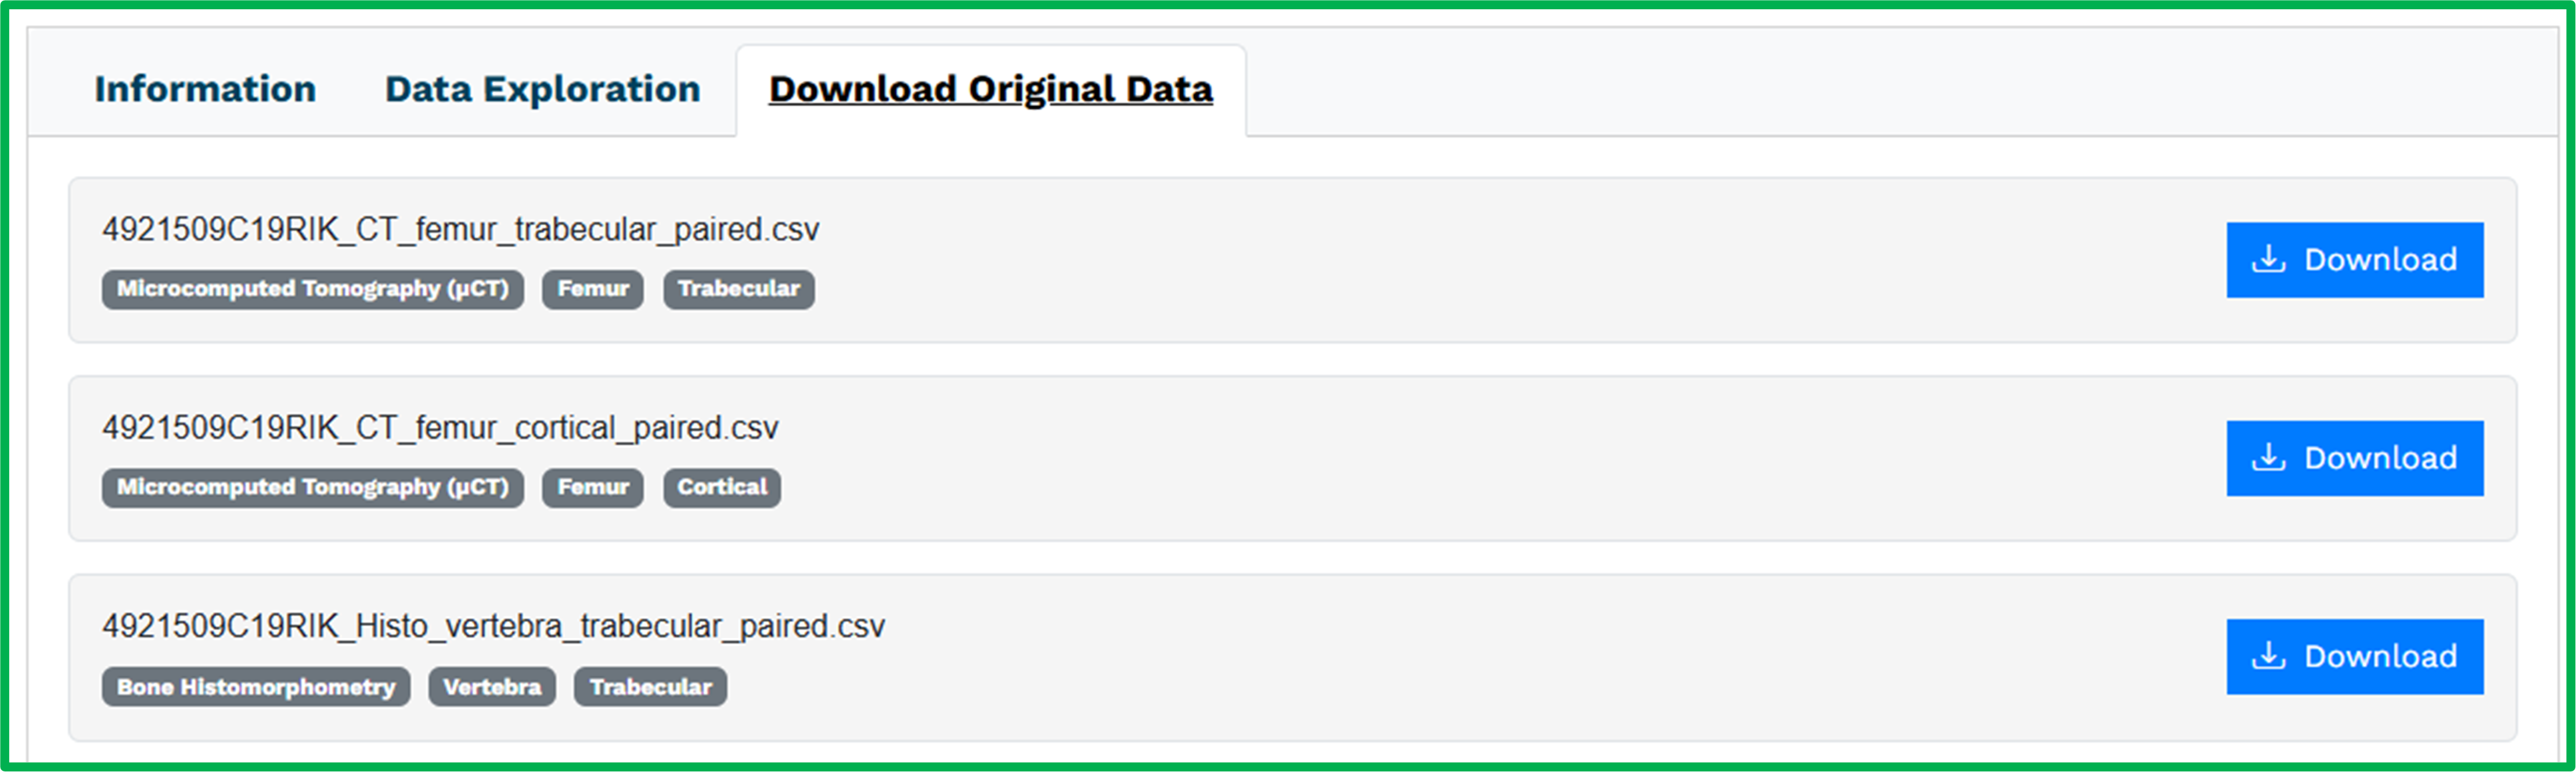
Tab 3: Download Original Data
The Download Original Data tab lists all the individual CSV files you uploaded to ROSSA during the data ingestion process. Users can download these spreadsheets directly to access your raw data in its original form.
Important: Because these files will be publicly accessible, we strongly encourage you to prepare your spreadsheets for public viewing before upload. Ensure that:
- Column headers are clear and professional
- Sample names are systematic and understandable
- No extraneous notes or unprofessional content is included
- The data is organized in a way that other researchers can readily interpret
Providing access to original data files ensures authenticity and transparency, allowing other researchers to verify your findings and potentially perform additional analyses.
Study Submission
Ready to Submit?
Prior to submission, please carefully review the report to ensure that the information and data displayed accurately represents your study. If everything looks correct, please confirm below and submit your study by clicking on the "submit study" button. Alternatively, if you need to make corrections, return to the form using the "Return to Form" button.
What Happens Next
Your study will be reviewed by the ROSSA curation team to ensure your submission is complete and accurate. This process typically takes 2 weeks. You may be contacted by a curator if clarification or additional information is needed. Once approved, your study will be publicly available in the ROSSA archive and fully citable.
If your study is currently under embargo, it will be securely archived but not publicly shared until you update your publication status. You will be notified when your study goes live.
Please save your submission ID for your records. You may need it if you contact us with questions about your submission.